Refleks-1P Inertial Measurement and Control Platform
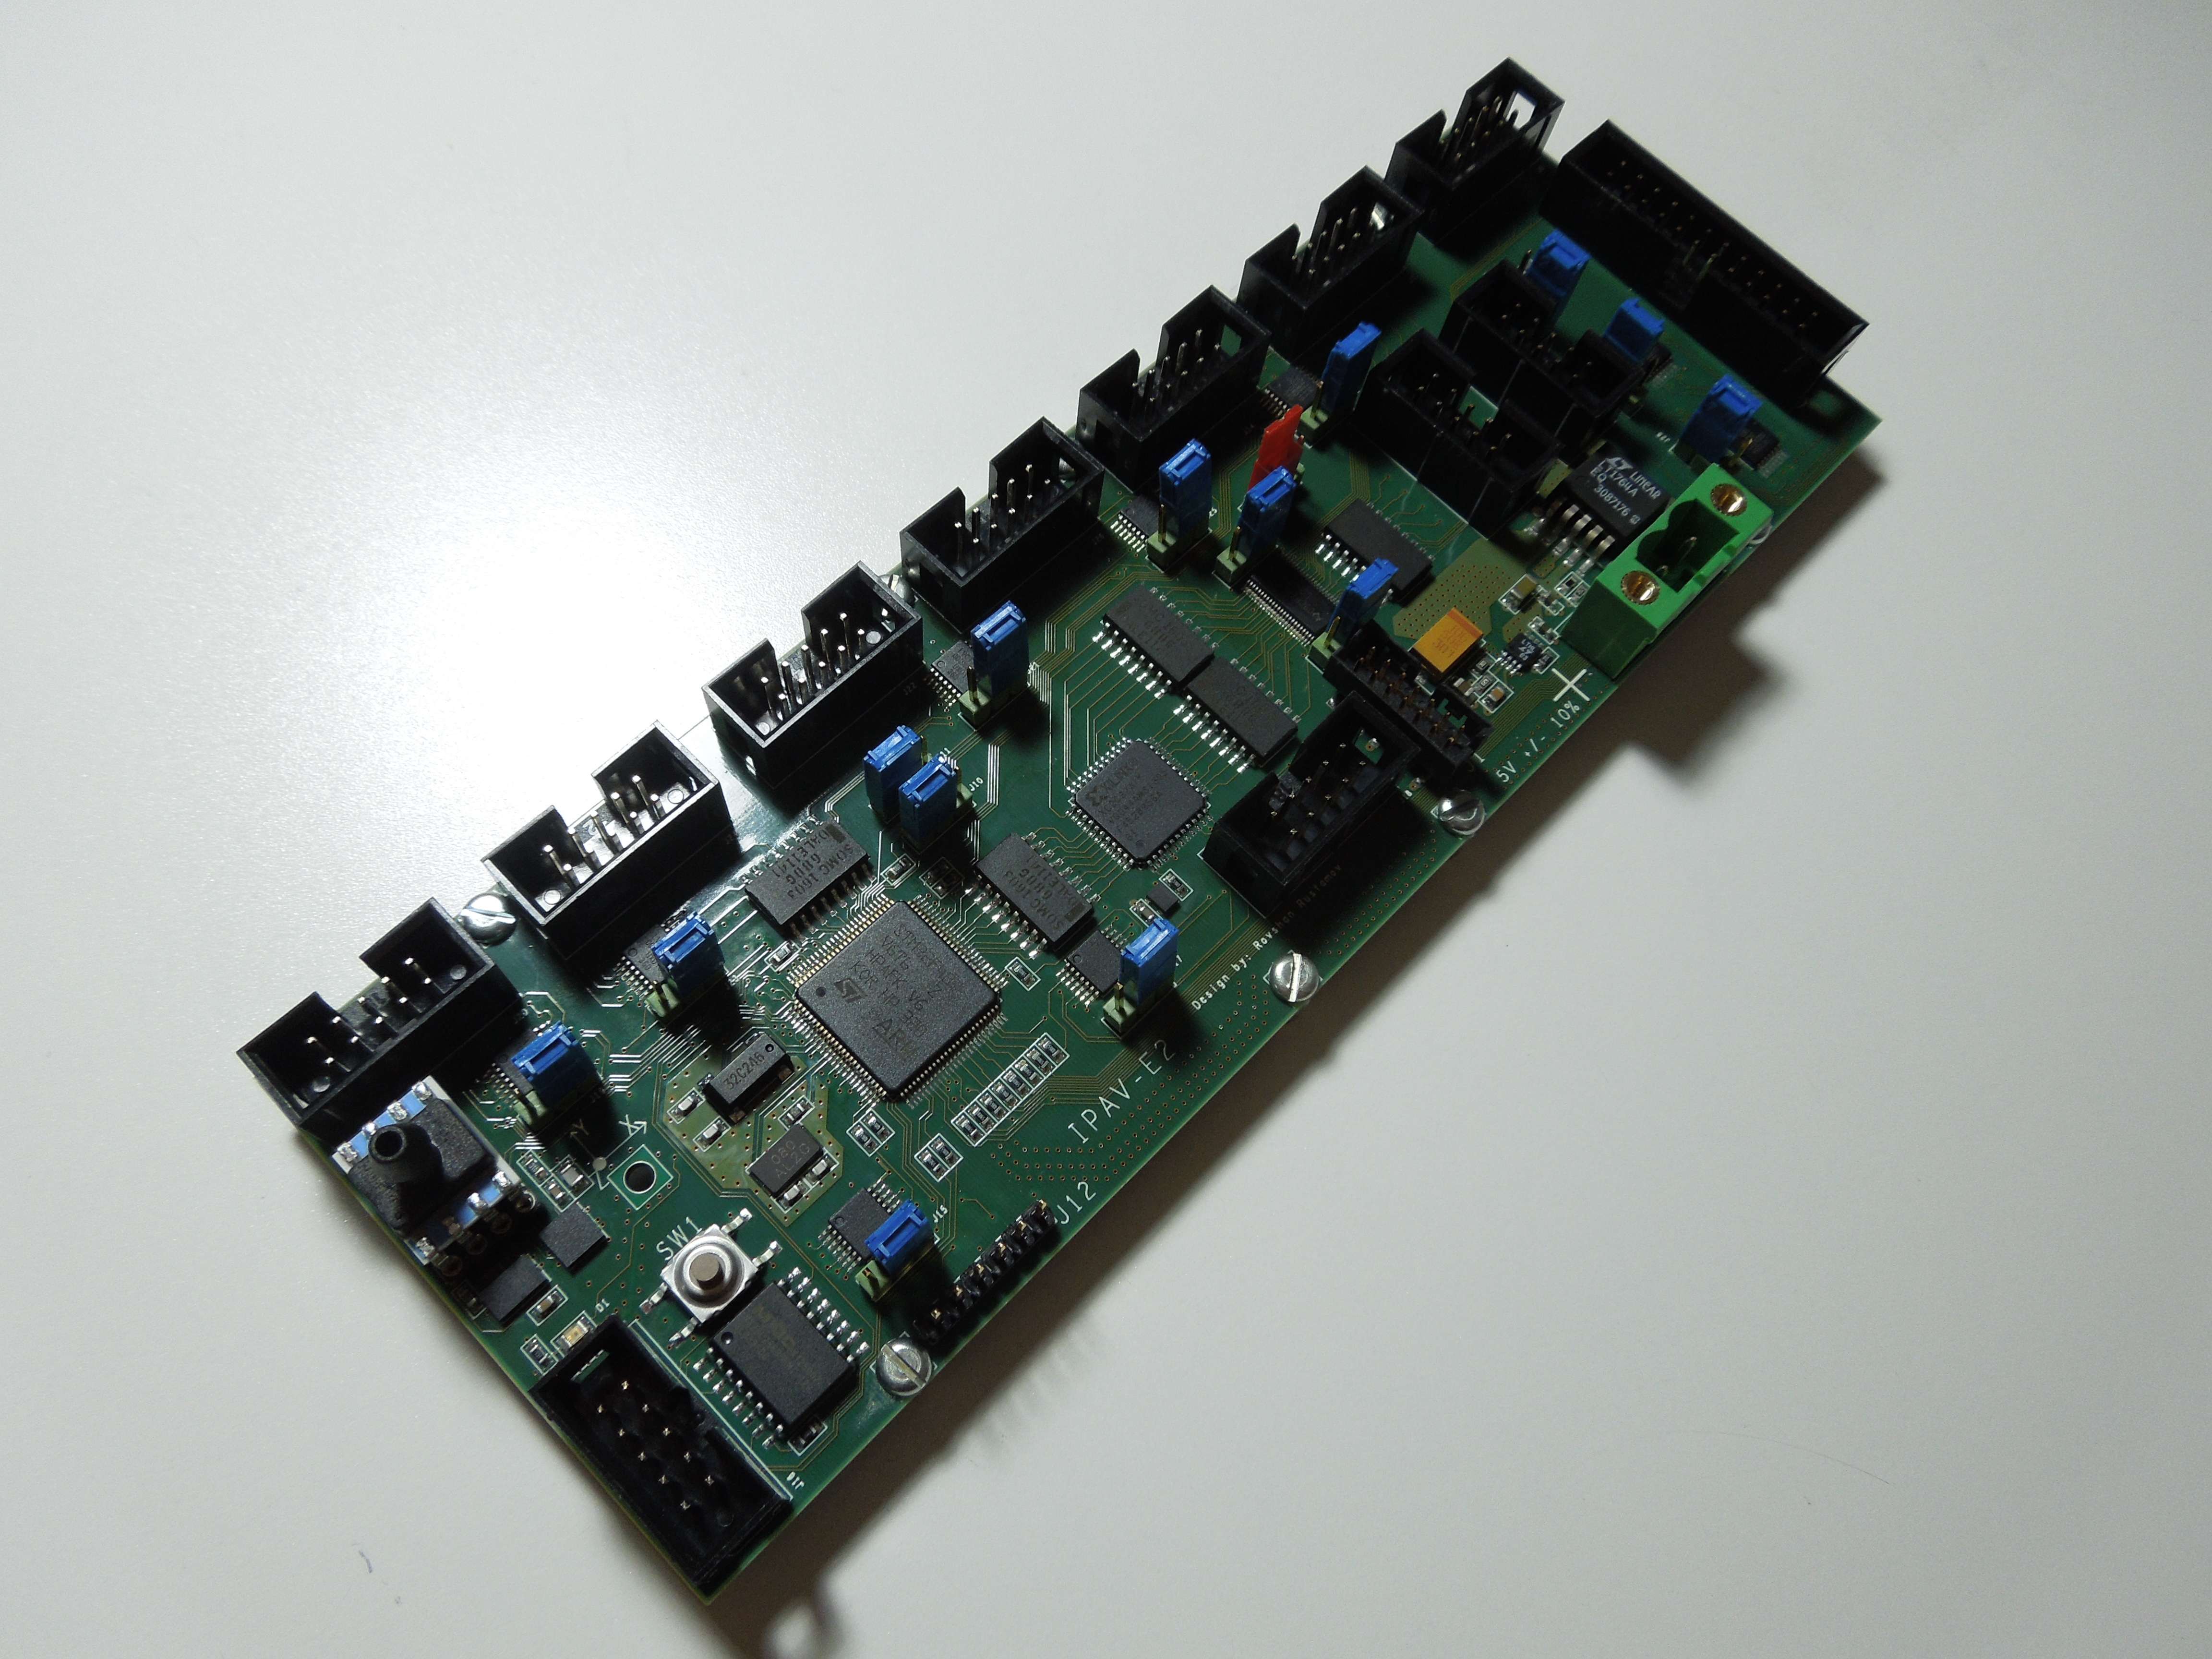
This board was designed as an instrumentation and measurement equipment to be used in various dynamical and control experiments. The board was successfully used in the high-altitude Rocket Launch experiment where its function was to record the dynamical flight data, as well as to control external devices which were also part of an experiment.
The board has the following features/chips:
- STM32F407 Microcontroller with ARM based Processor and max. frequency of 168 MHz
- MX25L256 32MB on-board Flash Memory
- XC2C32A CoolRunner Xilinx CPLD for Auxiliary Functions
- LSM303 Digital Output Accelerometer and Compass in a single chip
- L3G4200D Digital Output Gyroscope
- Absolute Pressure sensor with digital I2C/SPI output from Honeywell
- 2 user configurable SPI channels
- 3 USART/UART channels
- Over 50 User Configurable and externally buffered IOs
- The board manufactured on a high quality dielectric controlled FR408 PCB process
- All on-board components are rated for -40C:85C temperature range
- Easy access to SWD and JTAG programming support for STM32 and XC2C32A devices
Below the picture of the board. I assembled and soldered it all manually. Click to enlarge in new window.
High Altitude Rocket Launch
The Department of Mechanical and Aerospace Engineering in NMSU had a grant and opportunity to conduct an experiment related with a Rocket Launch. A nose cone payload space was given for them in a rocket to put in an experimental devices.
My job there was to design a control and measurement board which would record the flight parameters of the rocket when it reaches the apogee. Once the rocket reaches the apogee at more than 72 miles altitude it makes very slow movements which allows a relatively cheaper dynamical sensors to be used.
The board also had to control specific equipment within a payload container such as magnets and motors. The Refleks-1P platform which I developed, built and tested successfully accomplished all the tasks during a rocket experiment crucial to Department of Mechanical and Aerospace Engineering of NMSU.
The board was used together with another system which I developed, Refleks-1S. Enjoy the pictures of the board loaded in a rocket, launch preparation and launch itself.
The Refleks-1P and Refleks-1S loaded in the nose cone section of payload container.
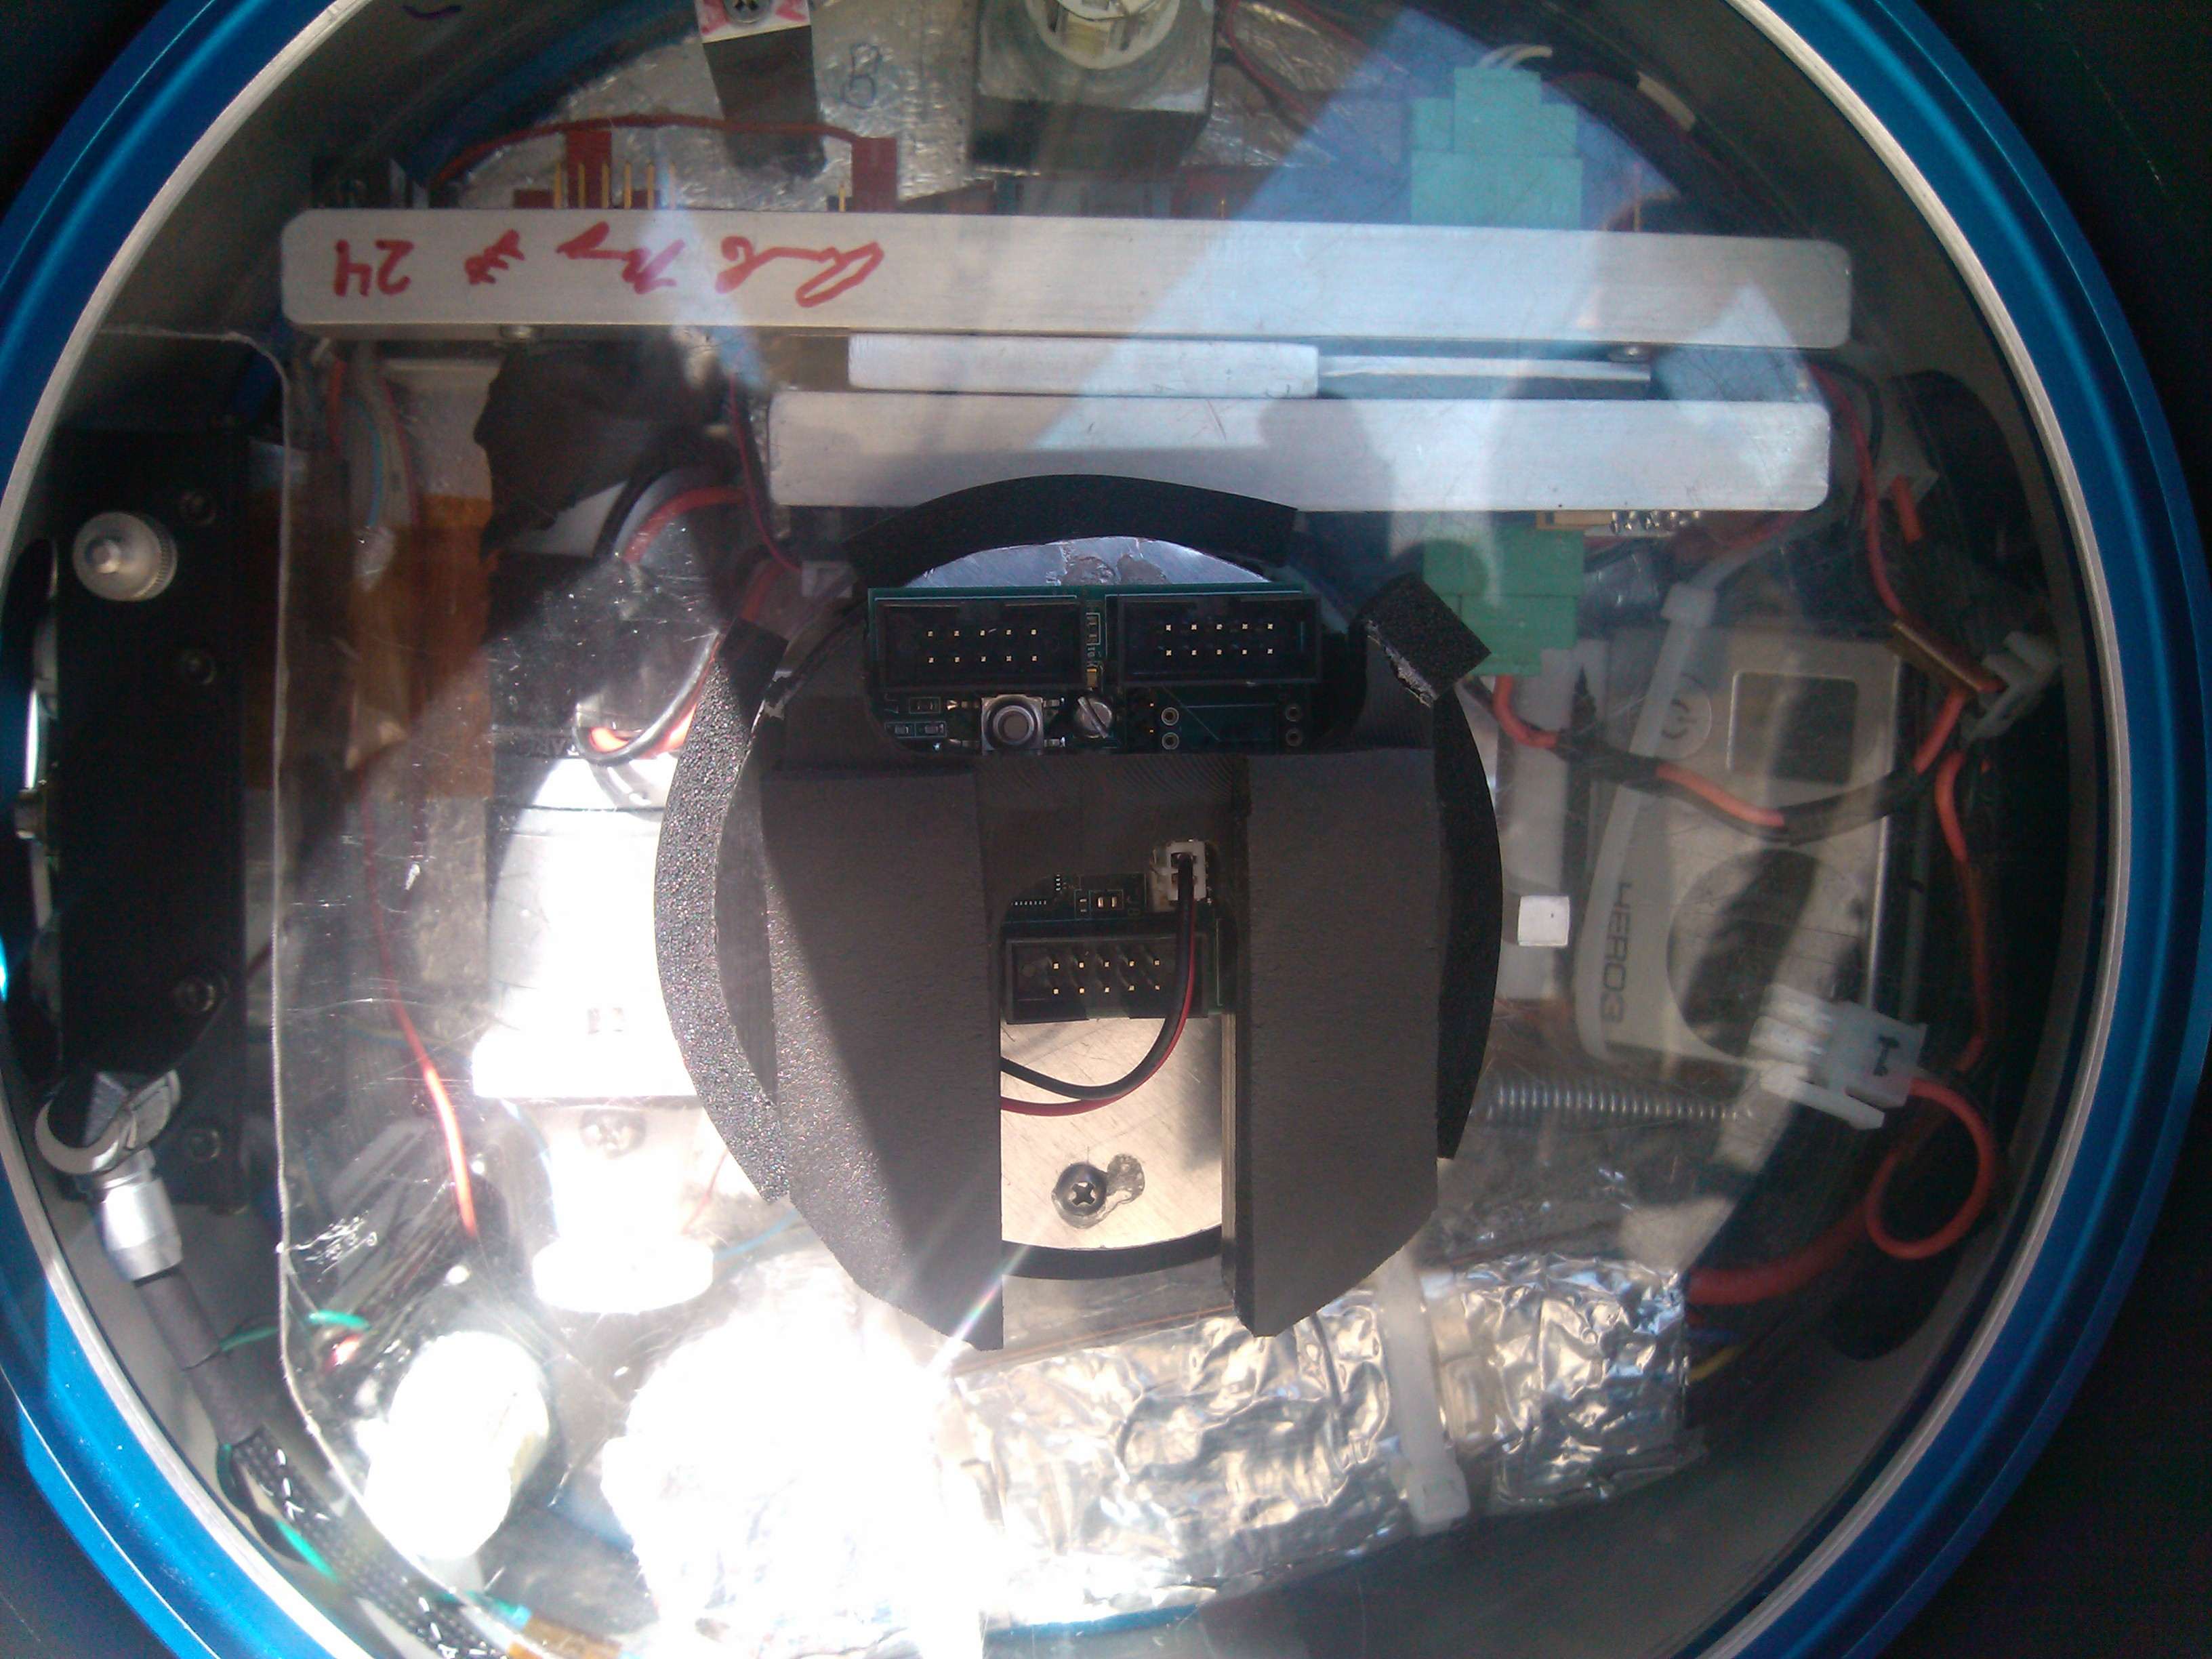
View of the Rocket without nose cone
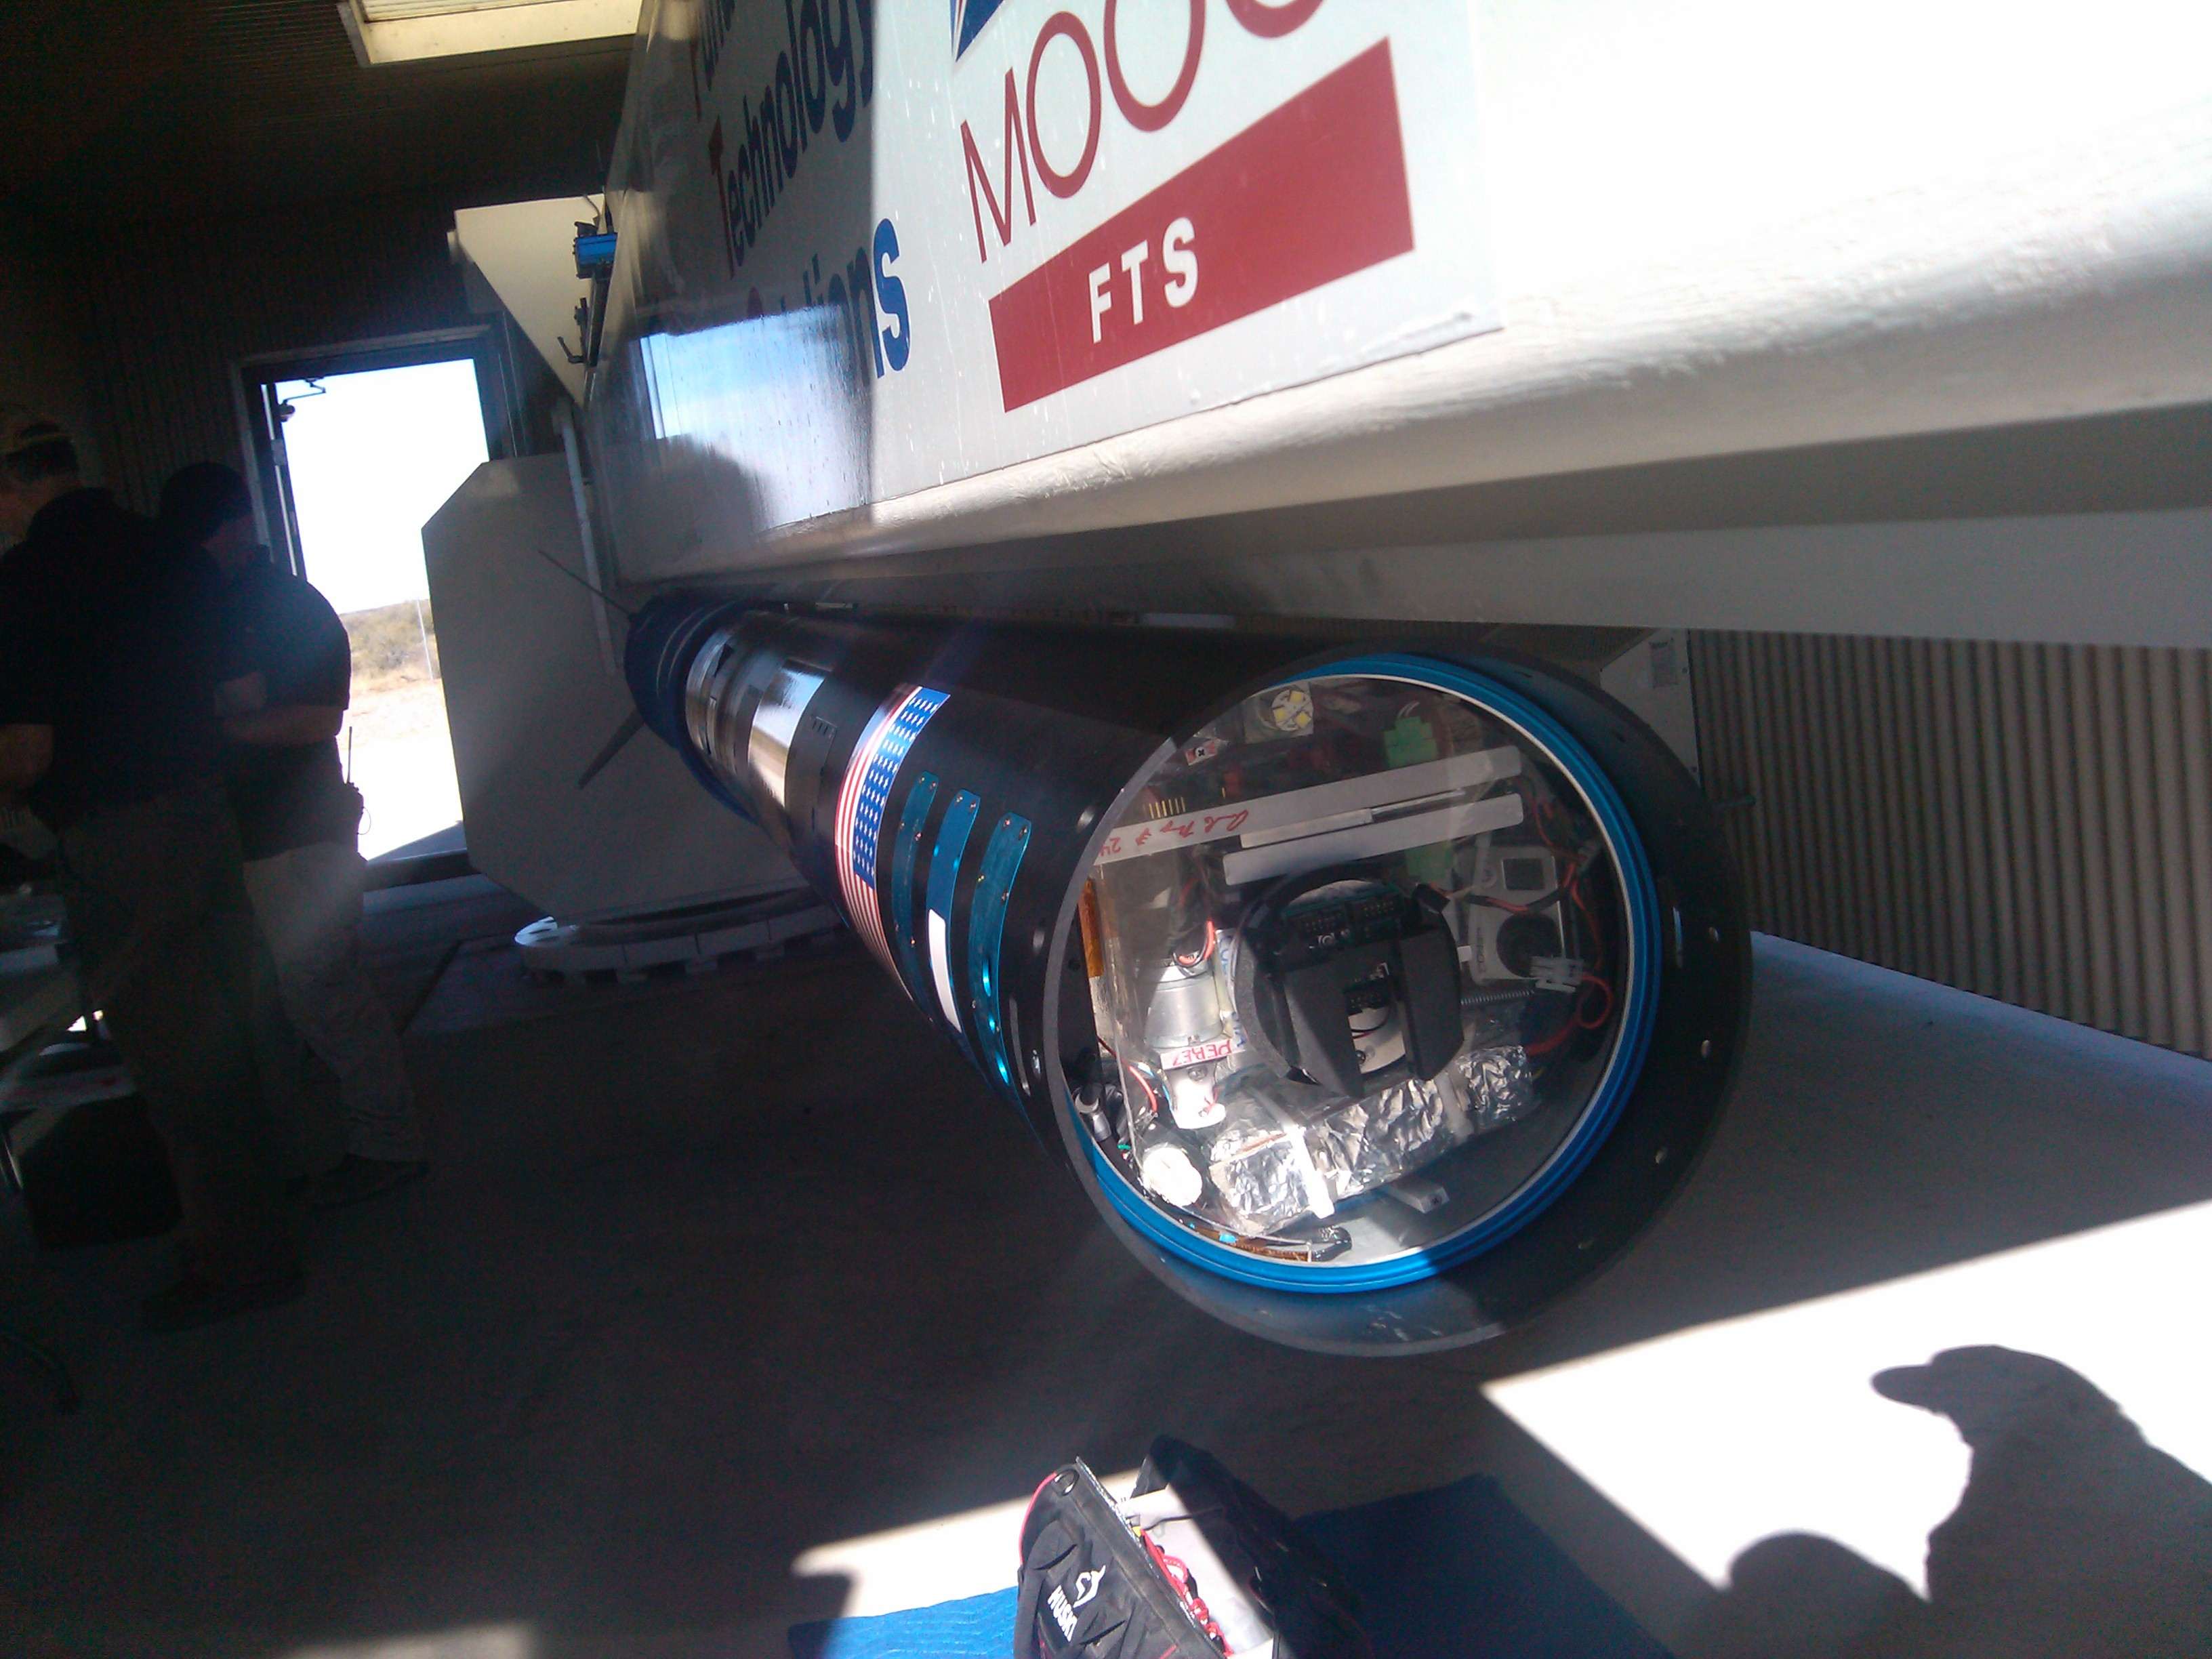
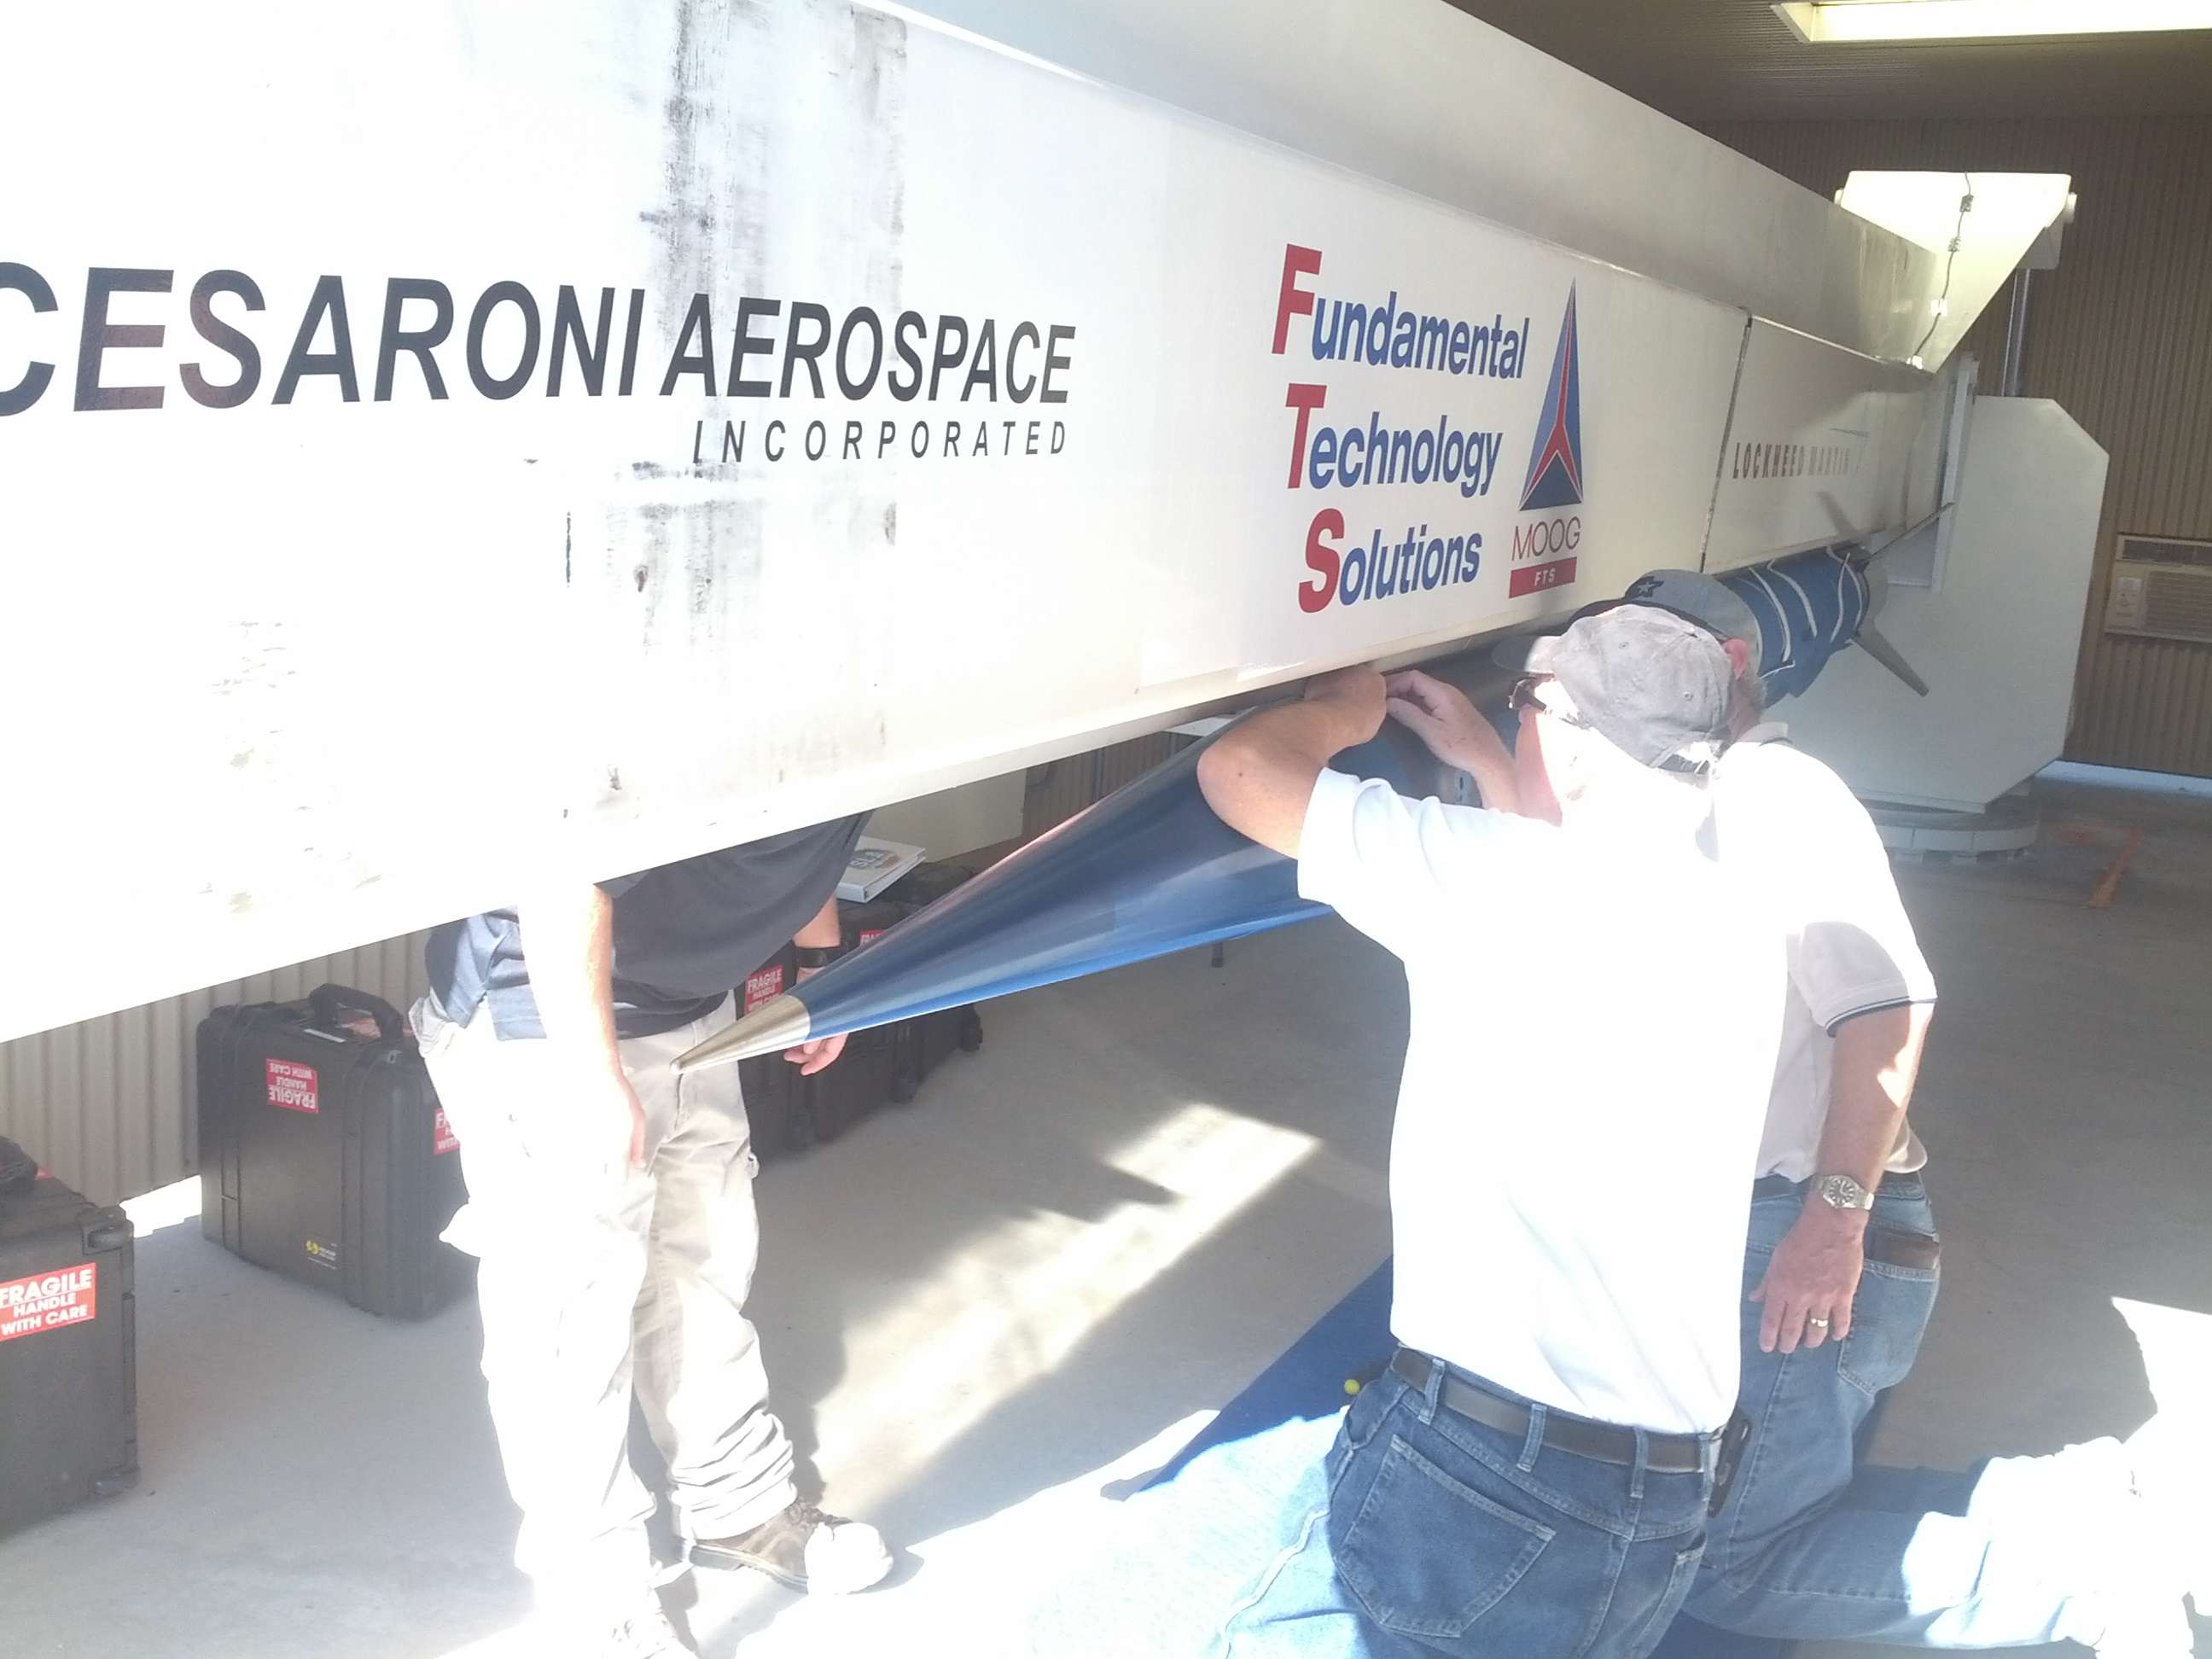
Technicians attaching the nose cone
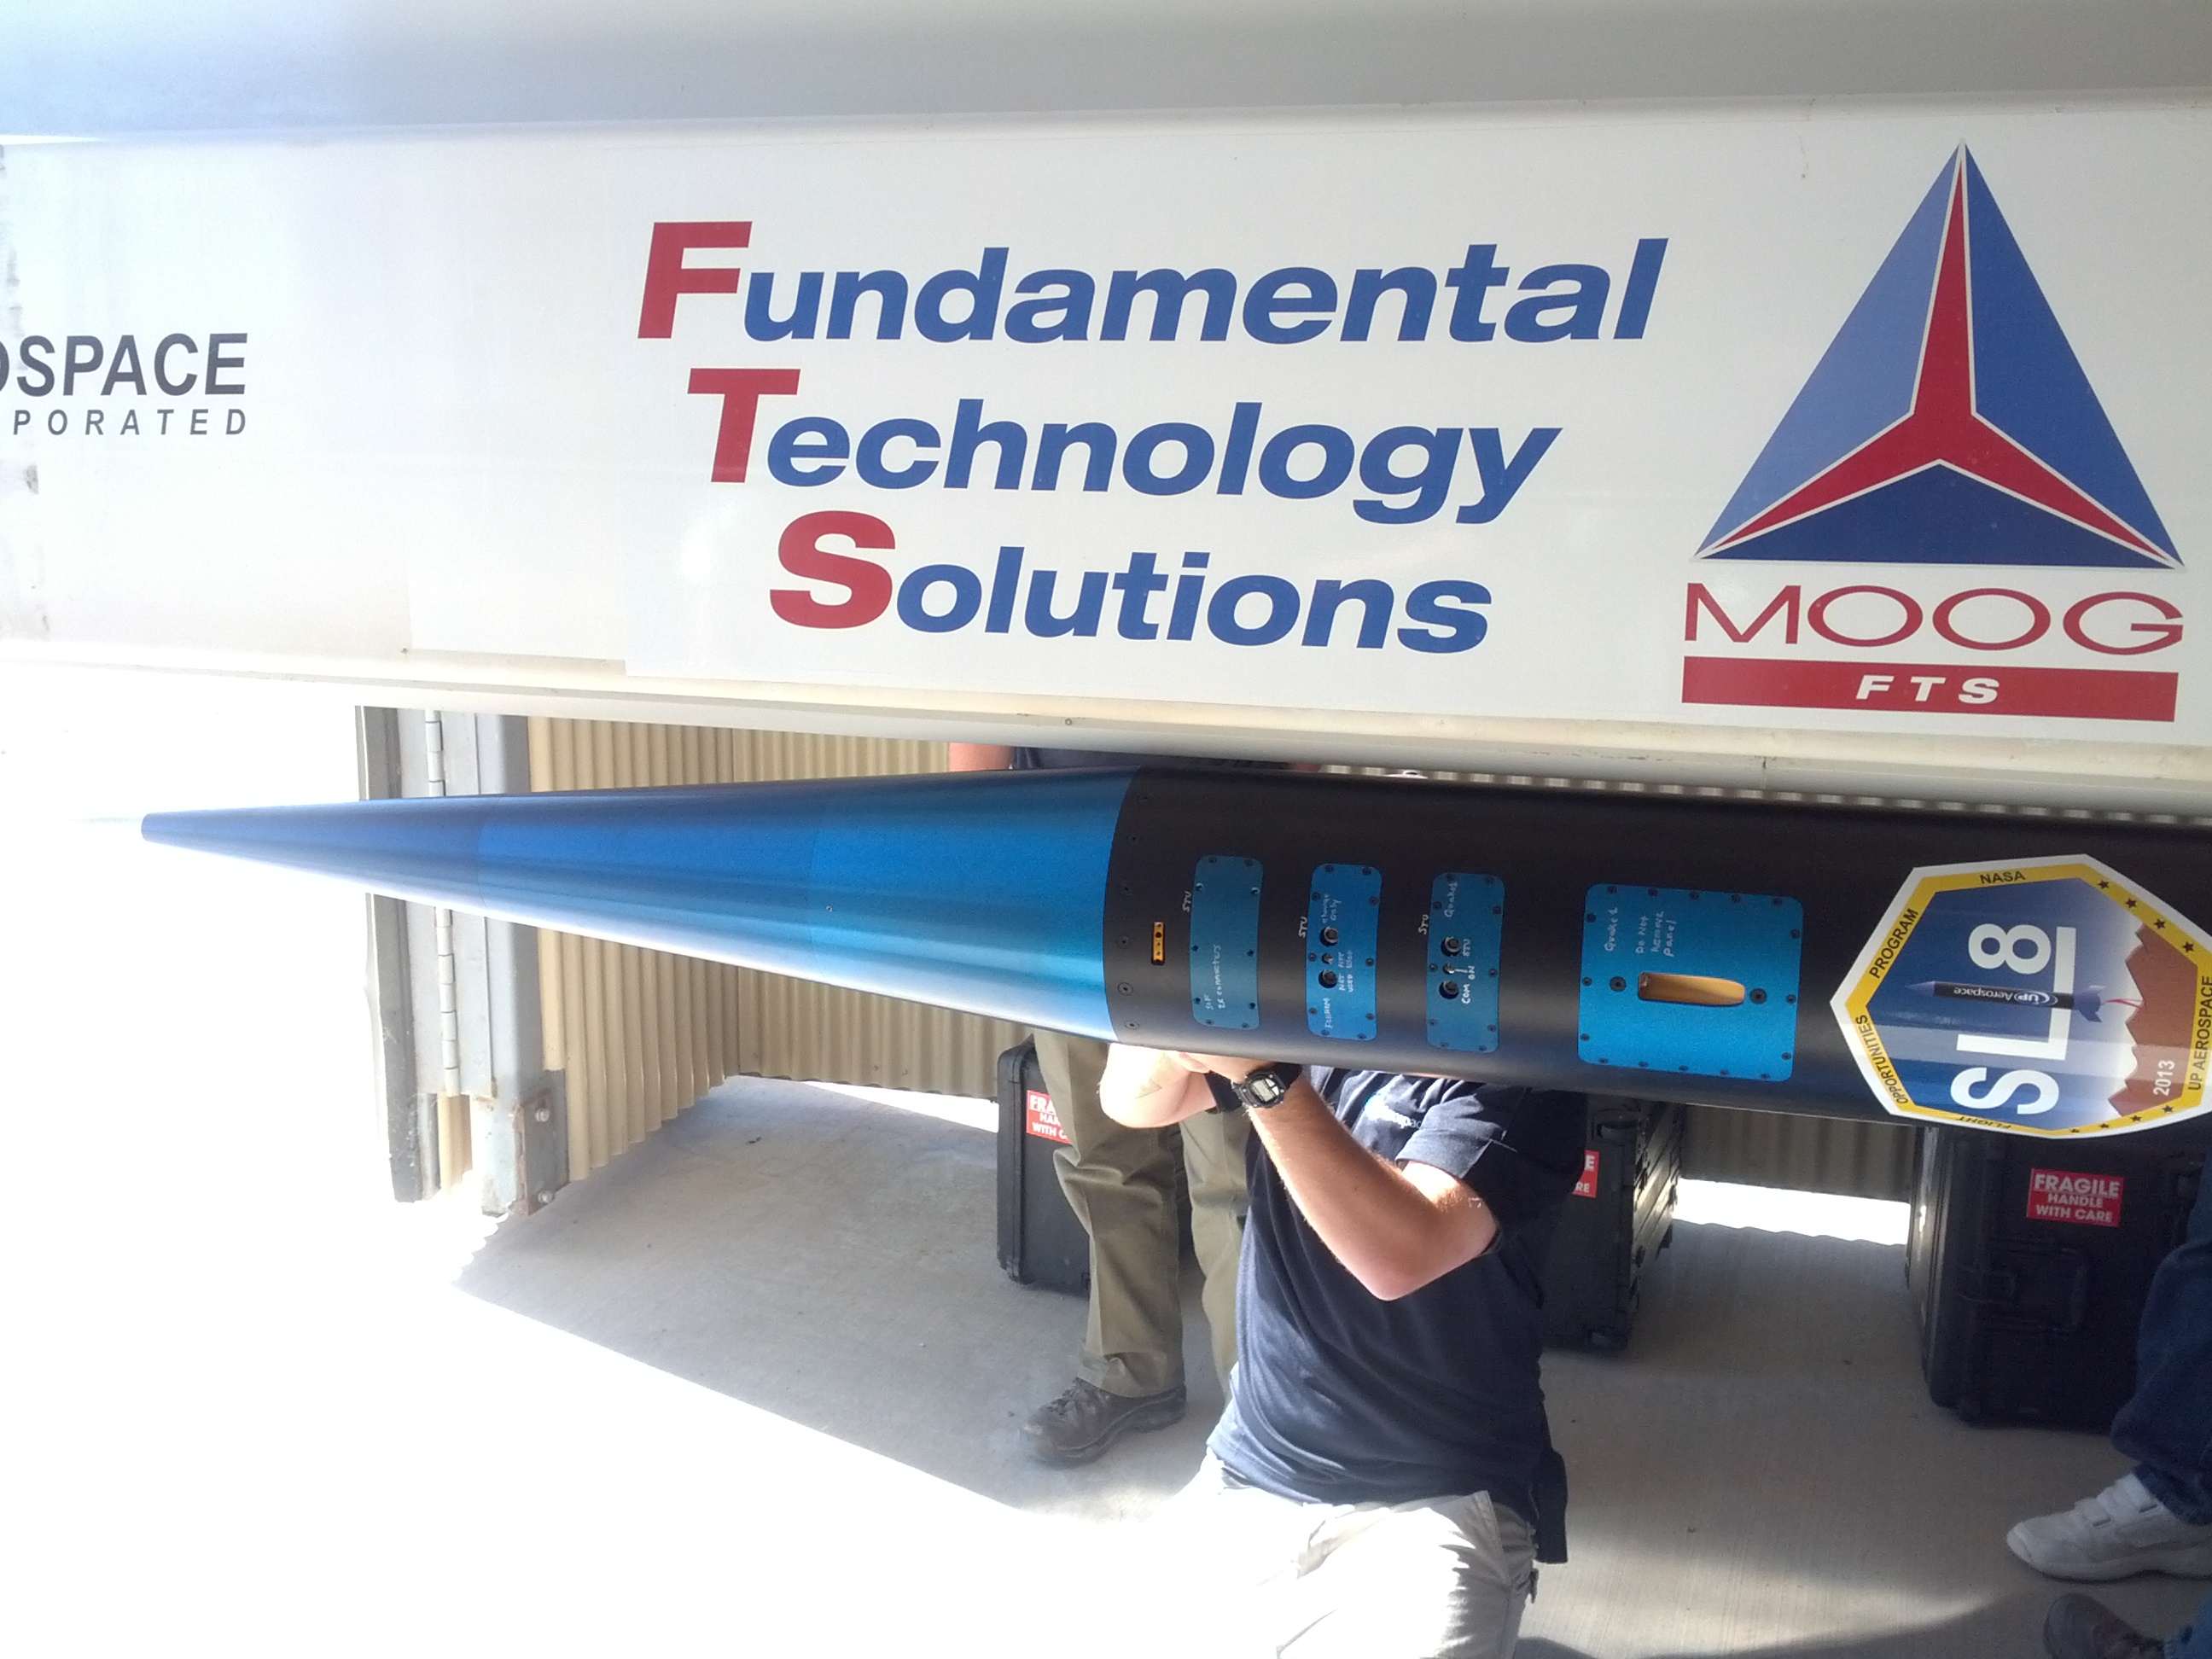
and checking the rocket
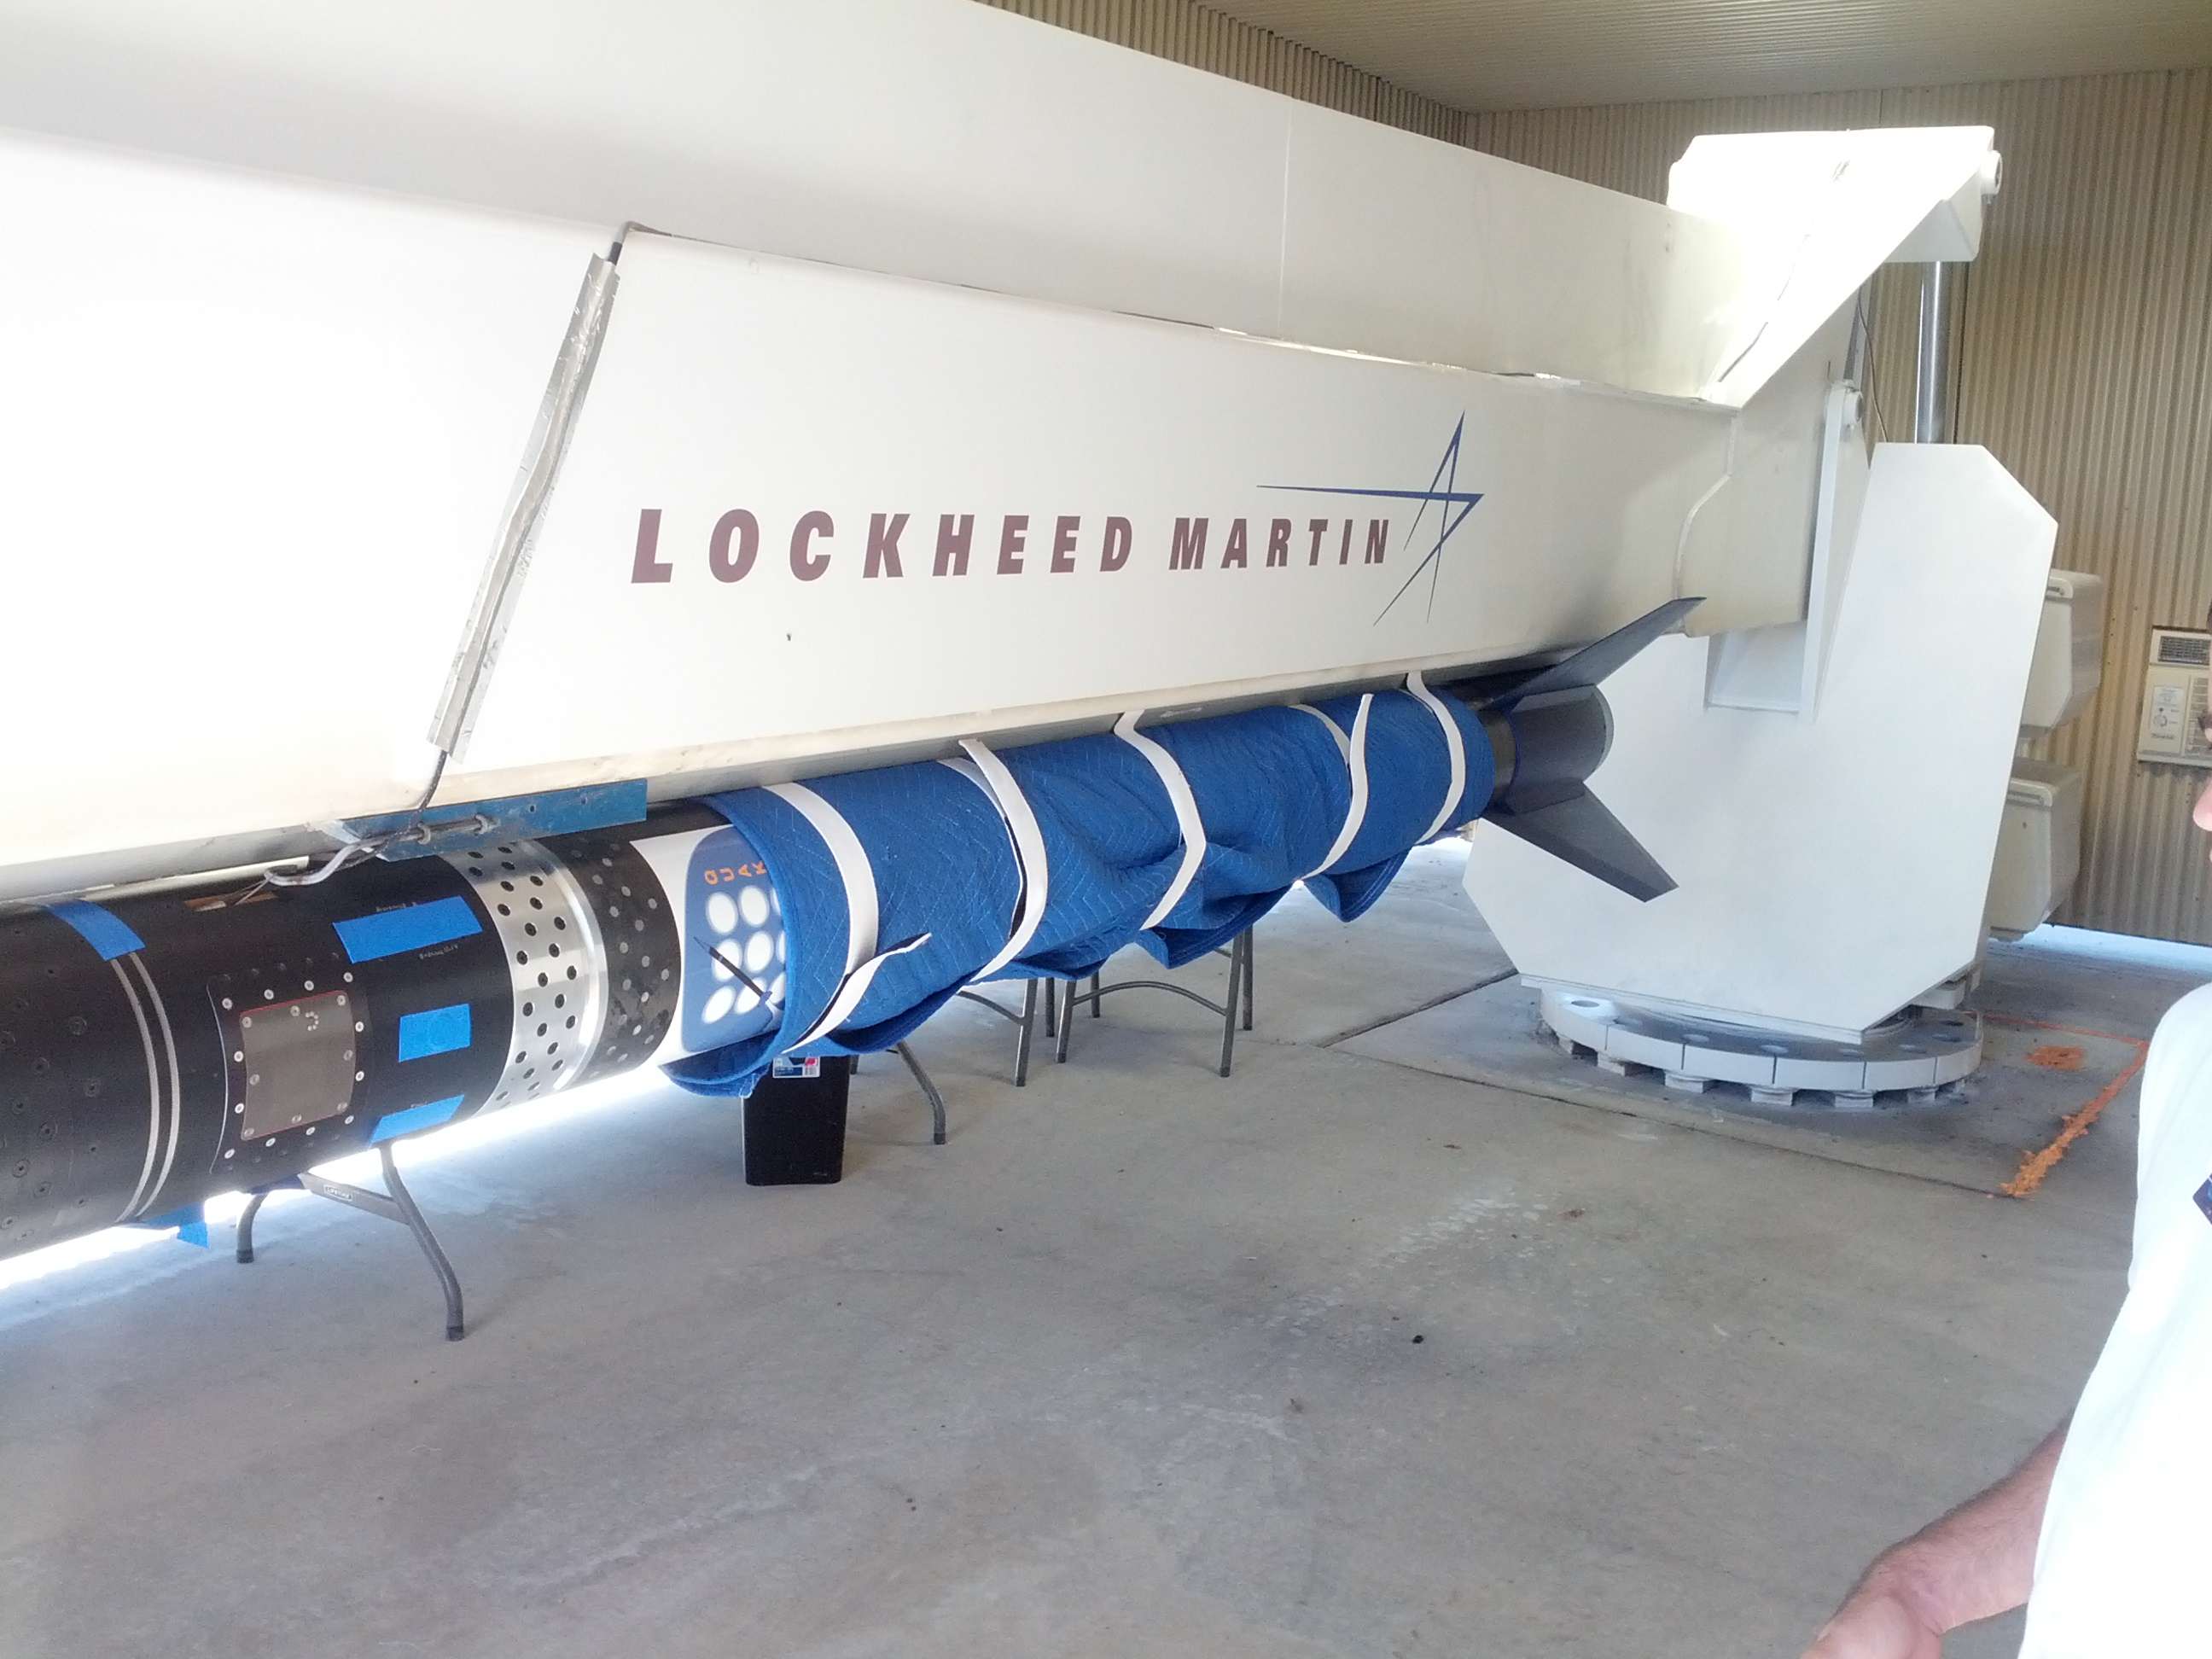
rocket view in a horizontal position
Launch!
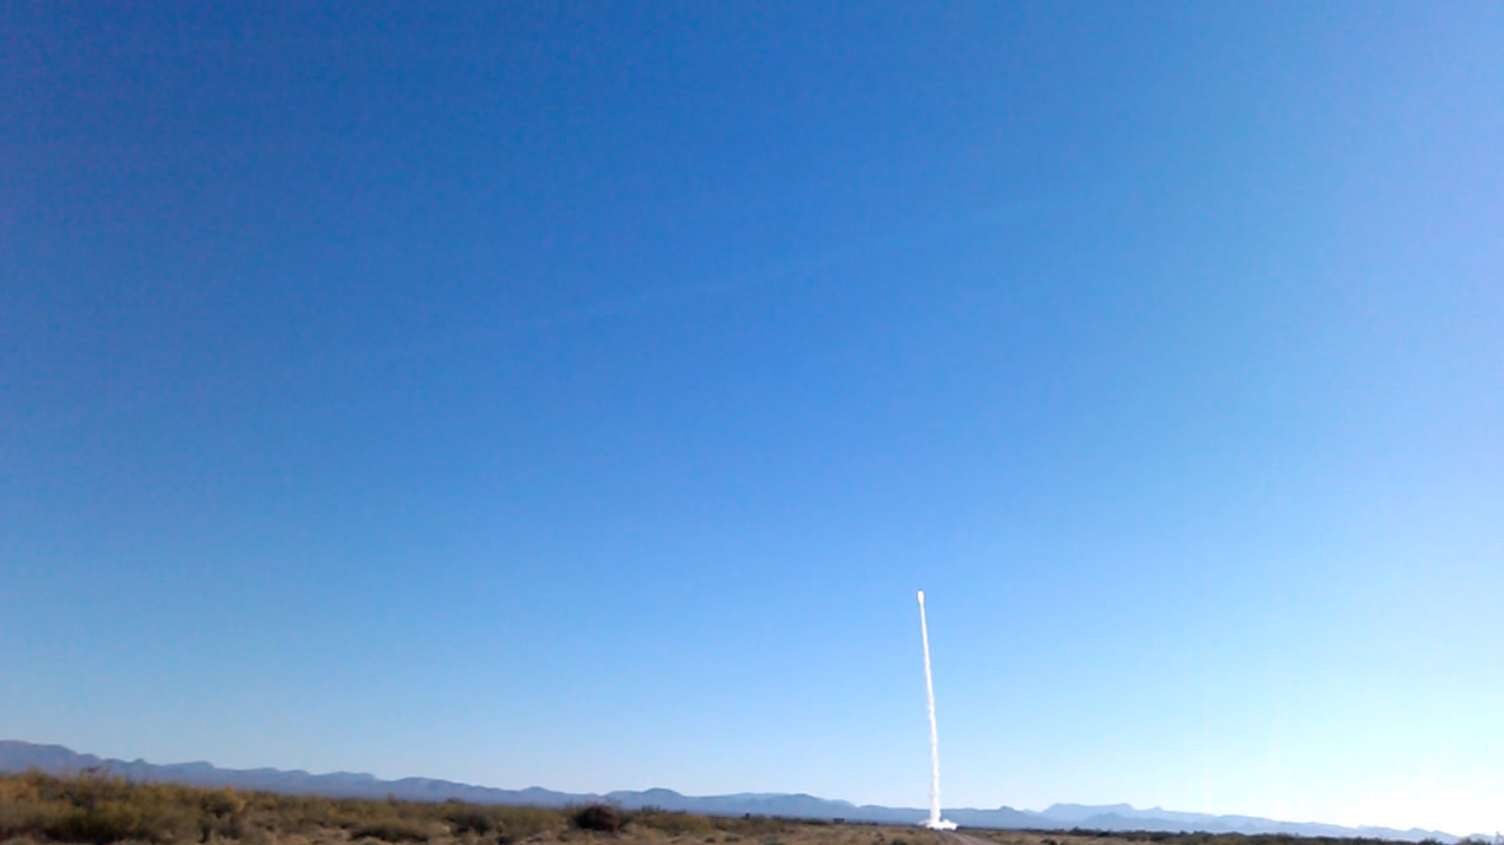
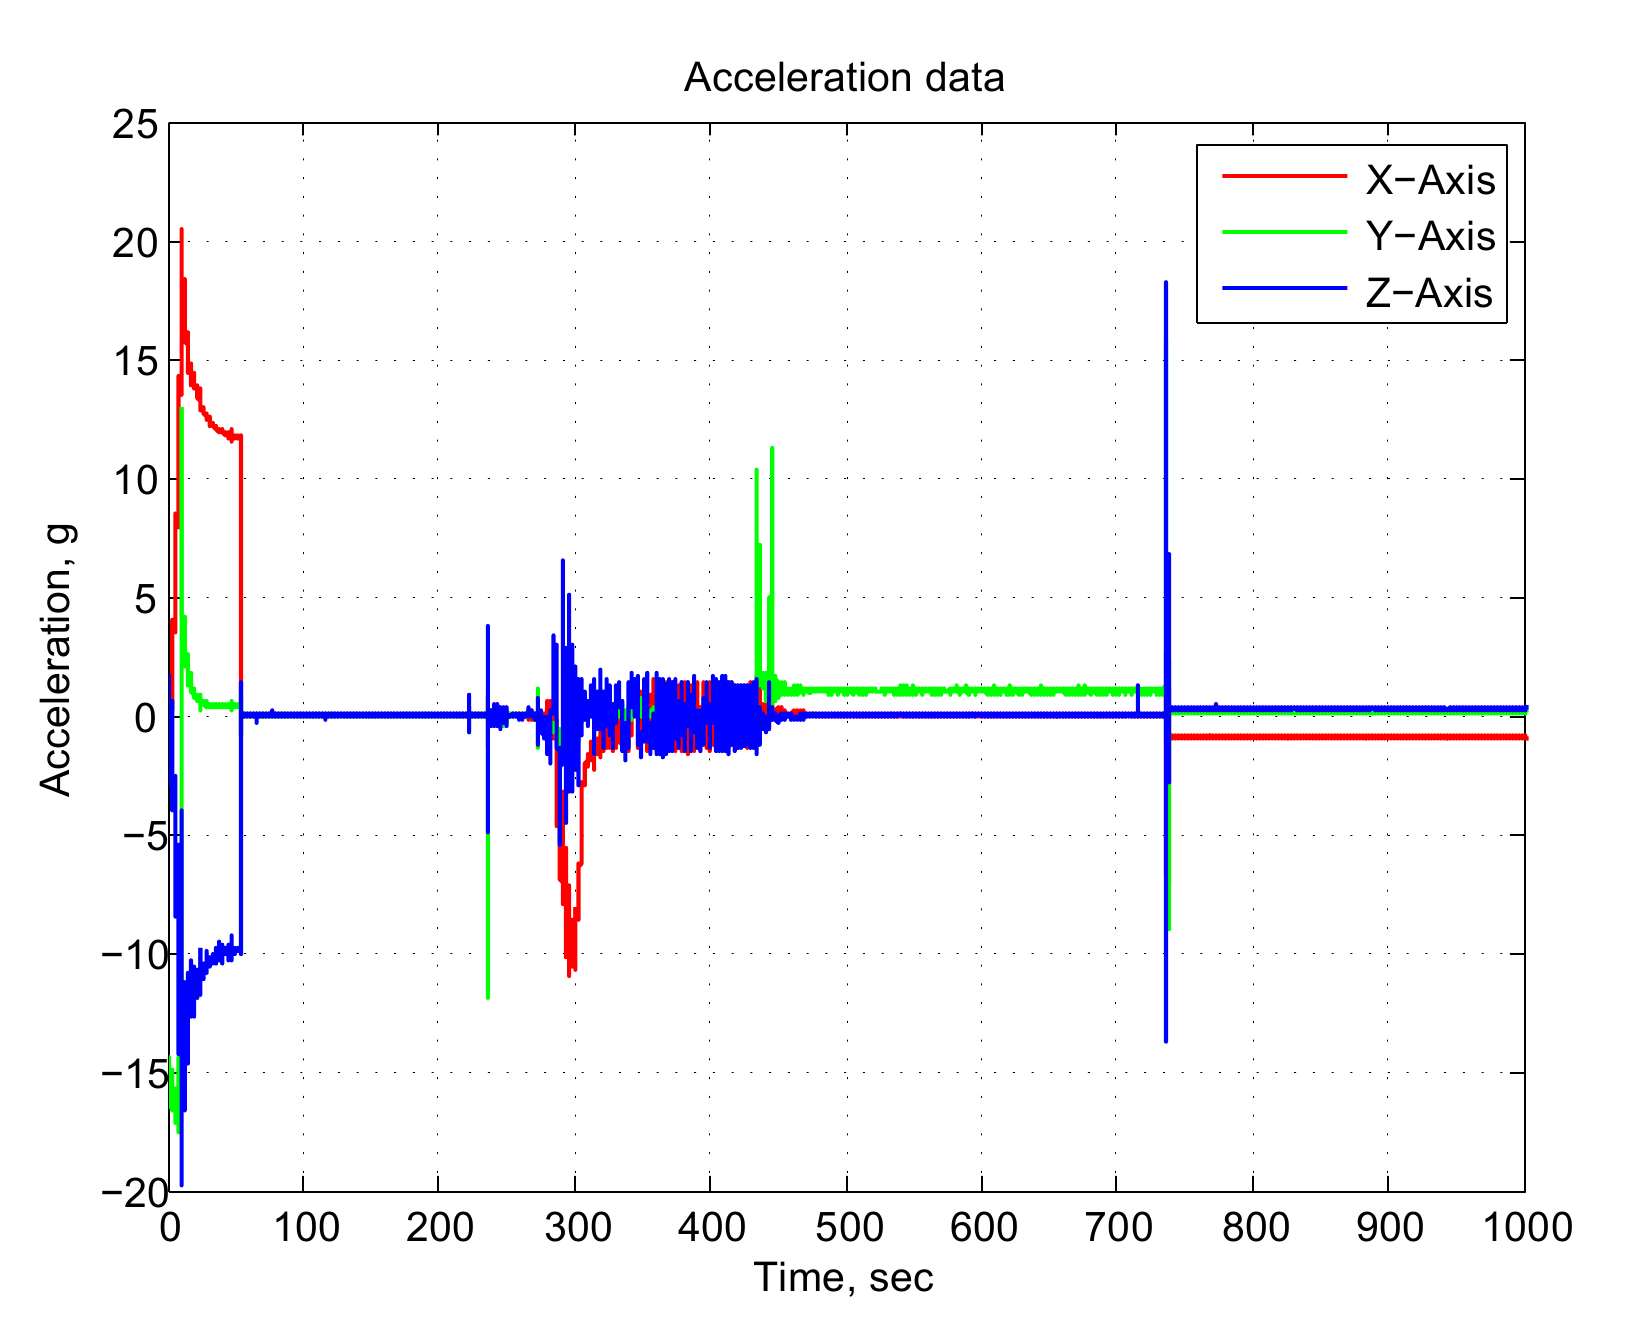
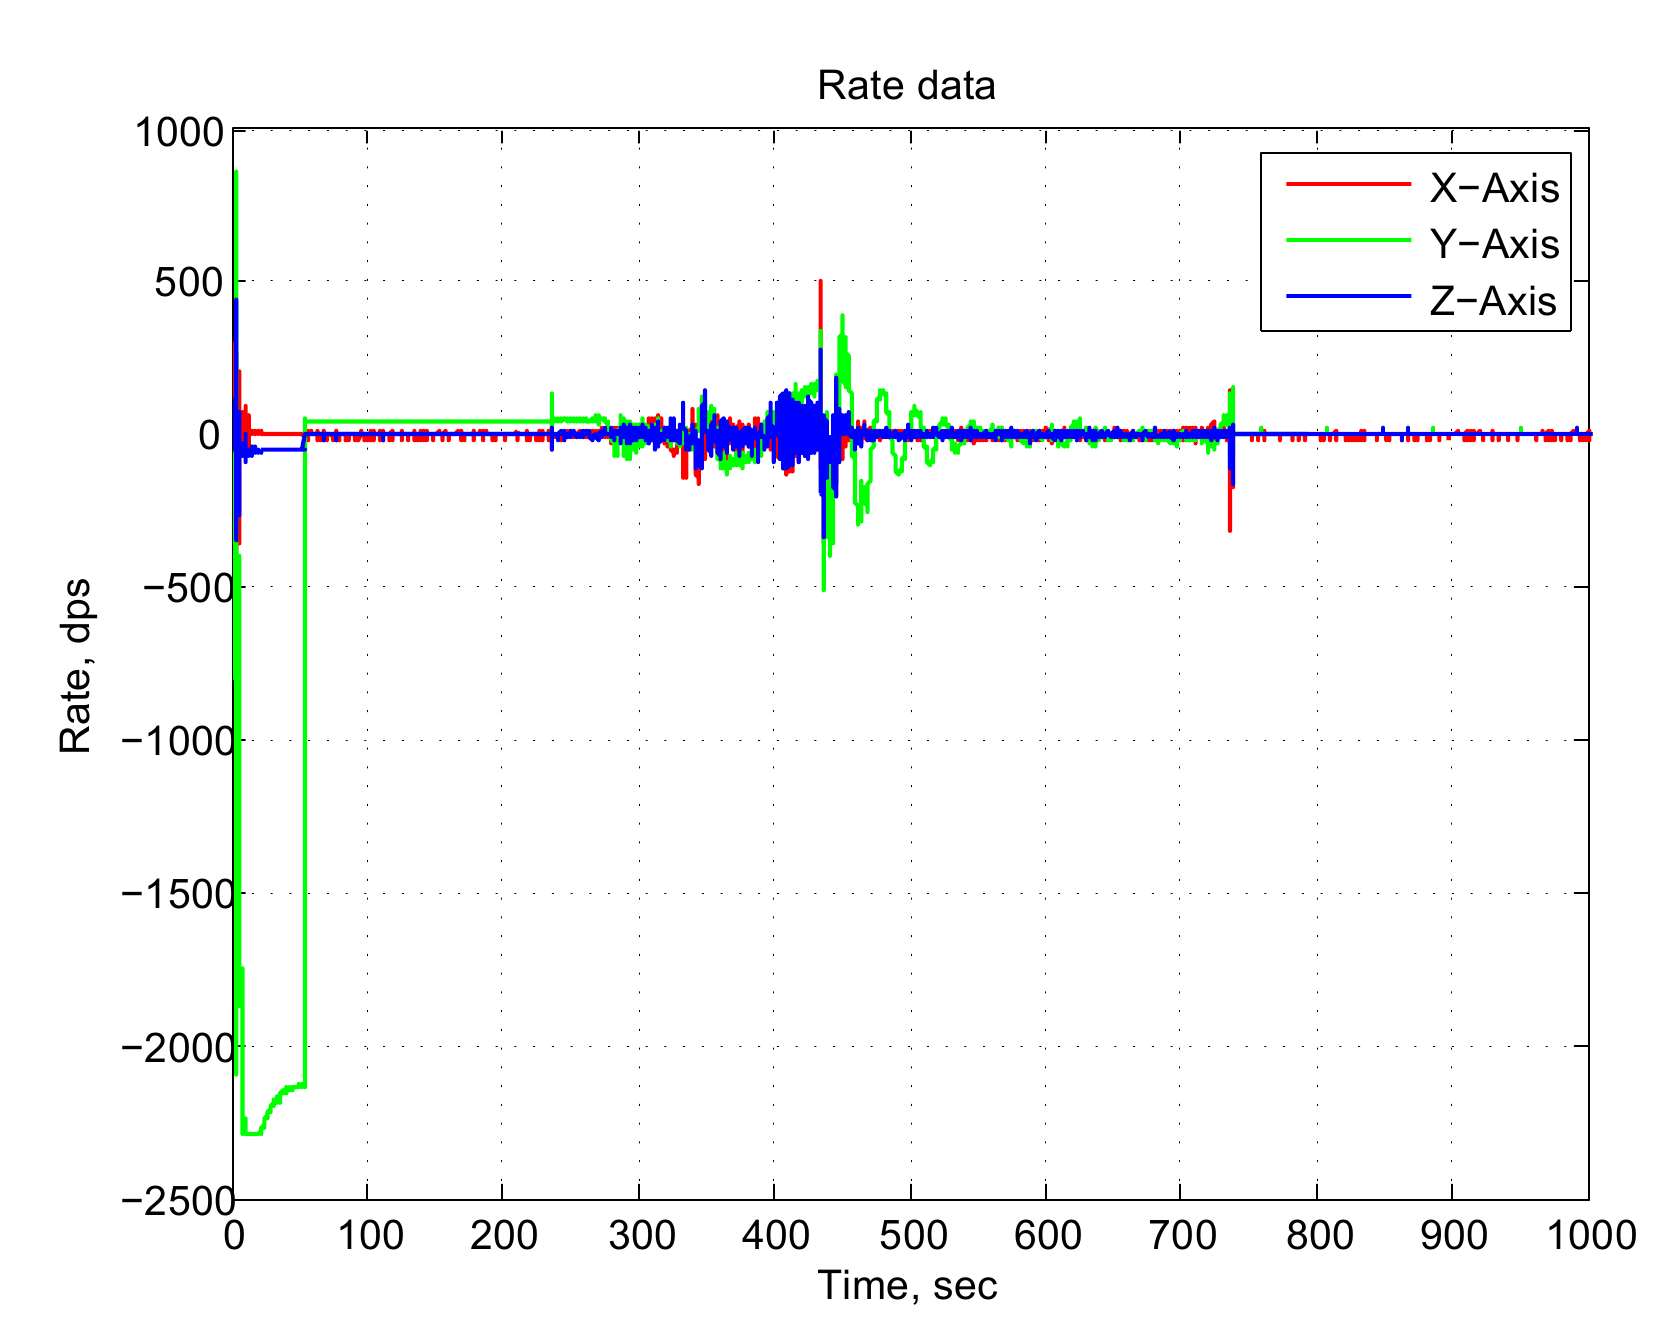
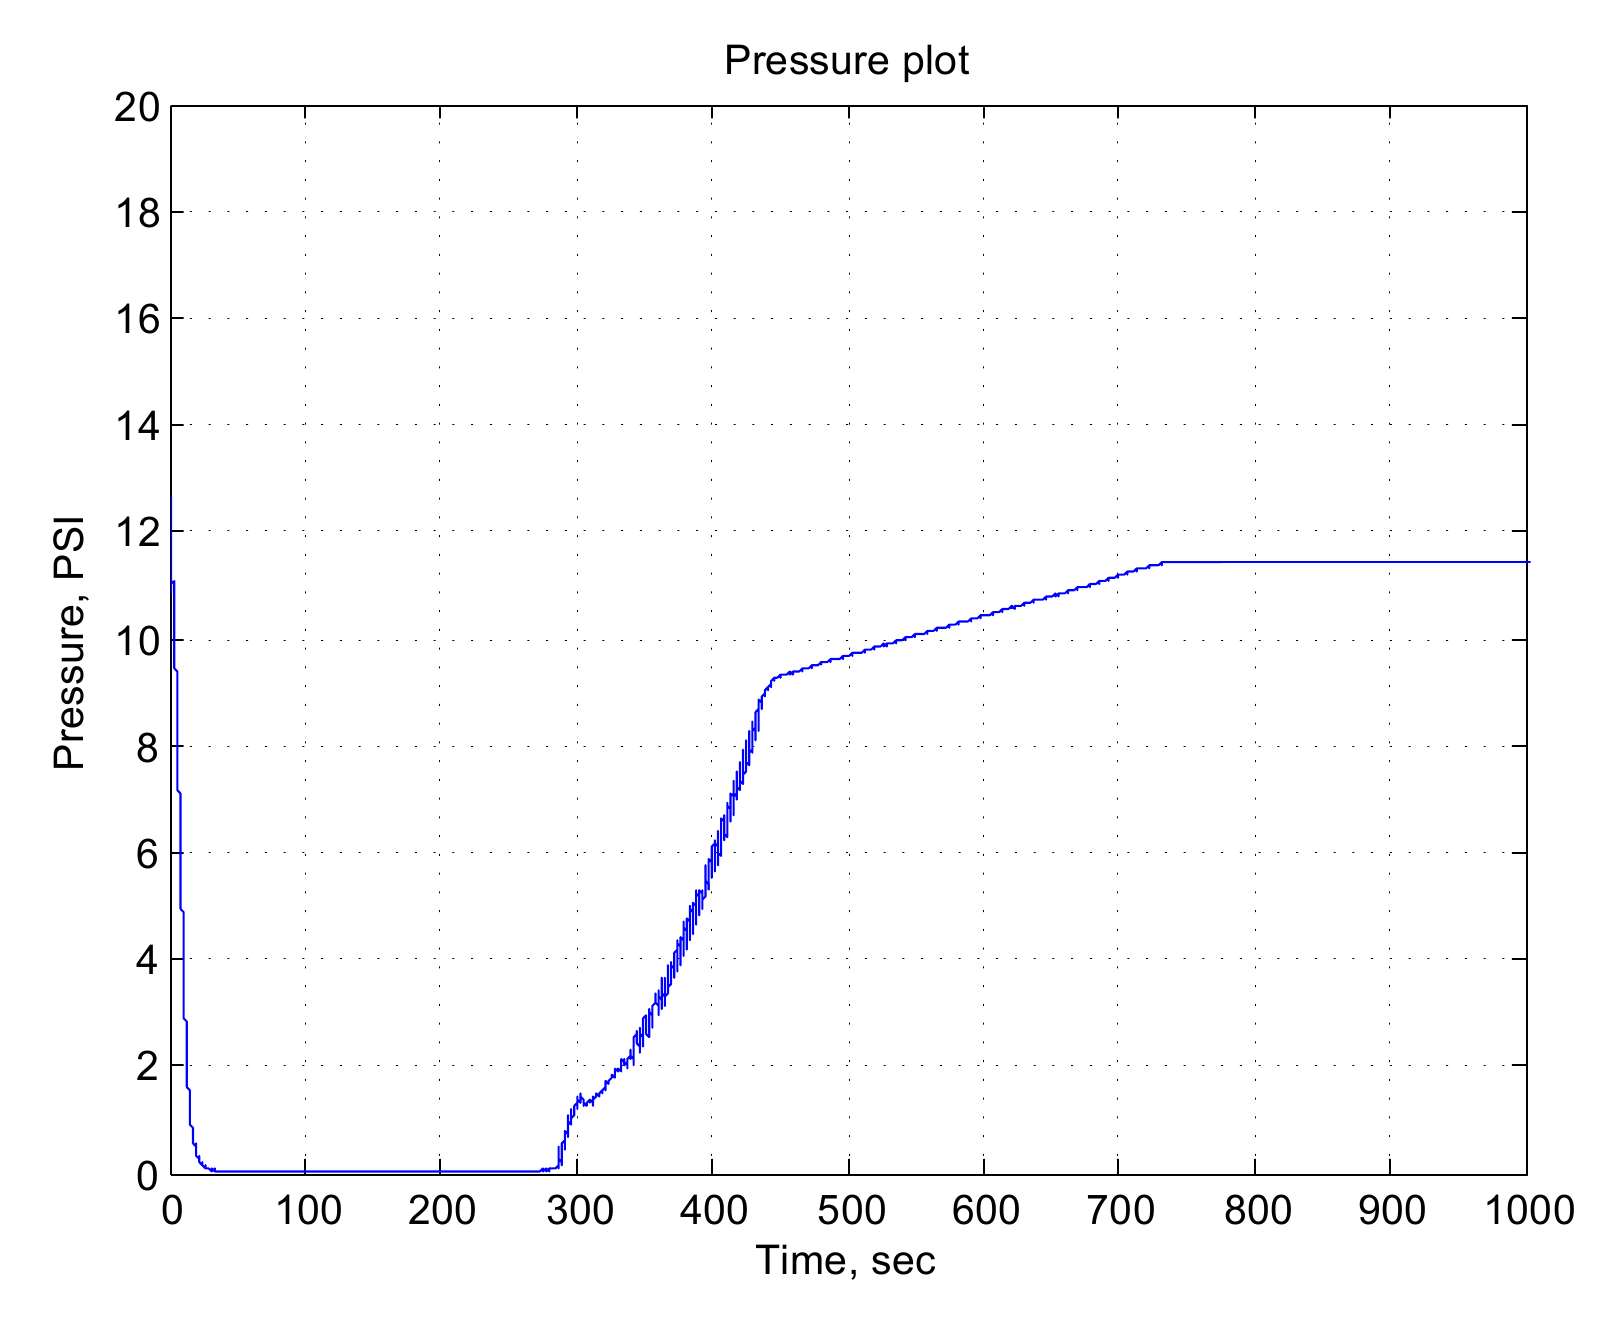
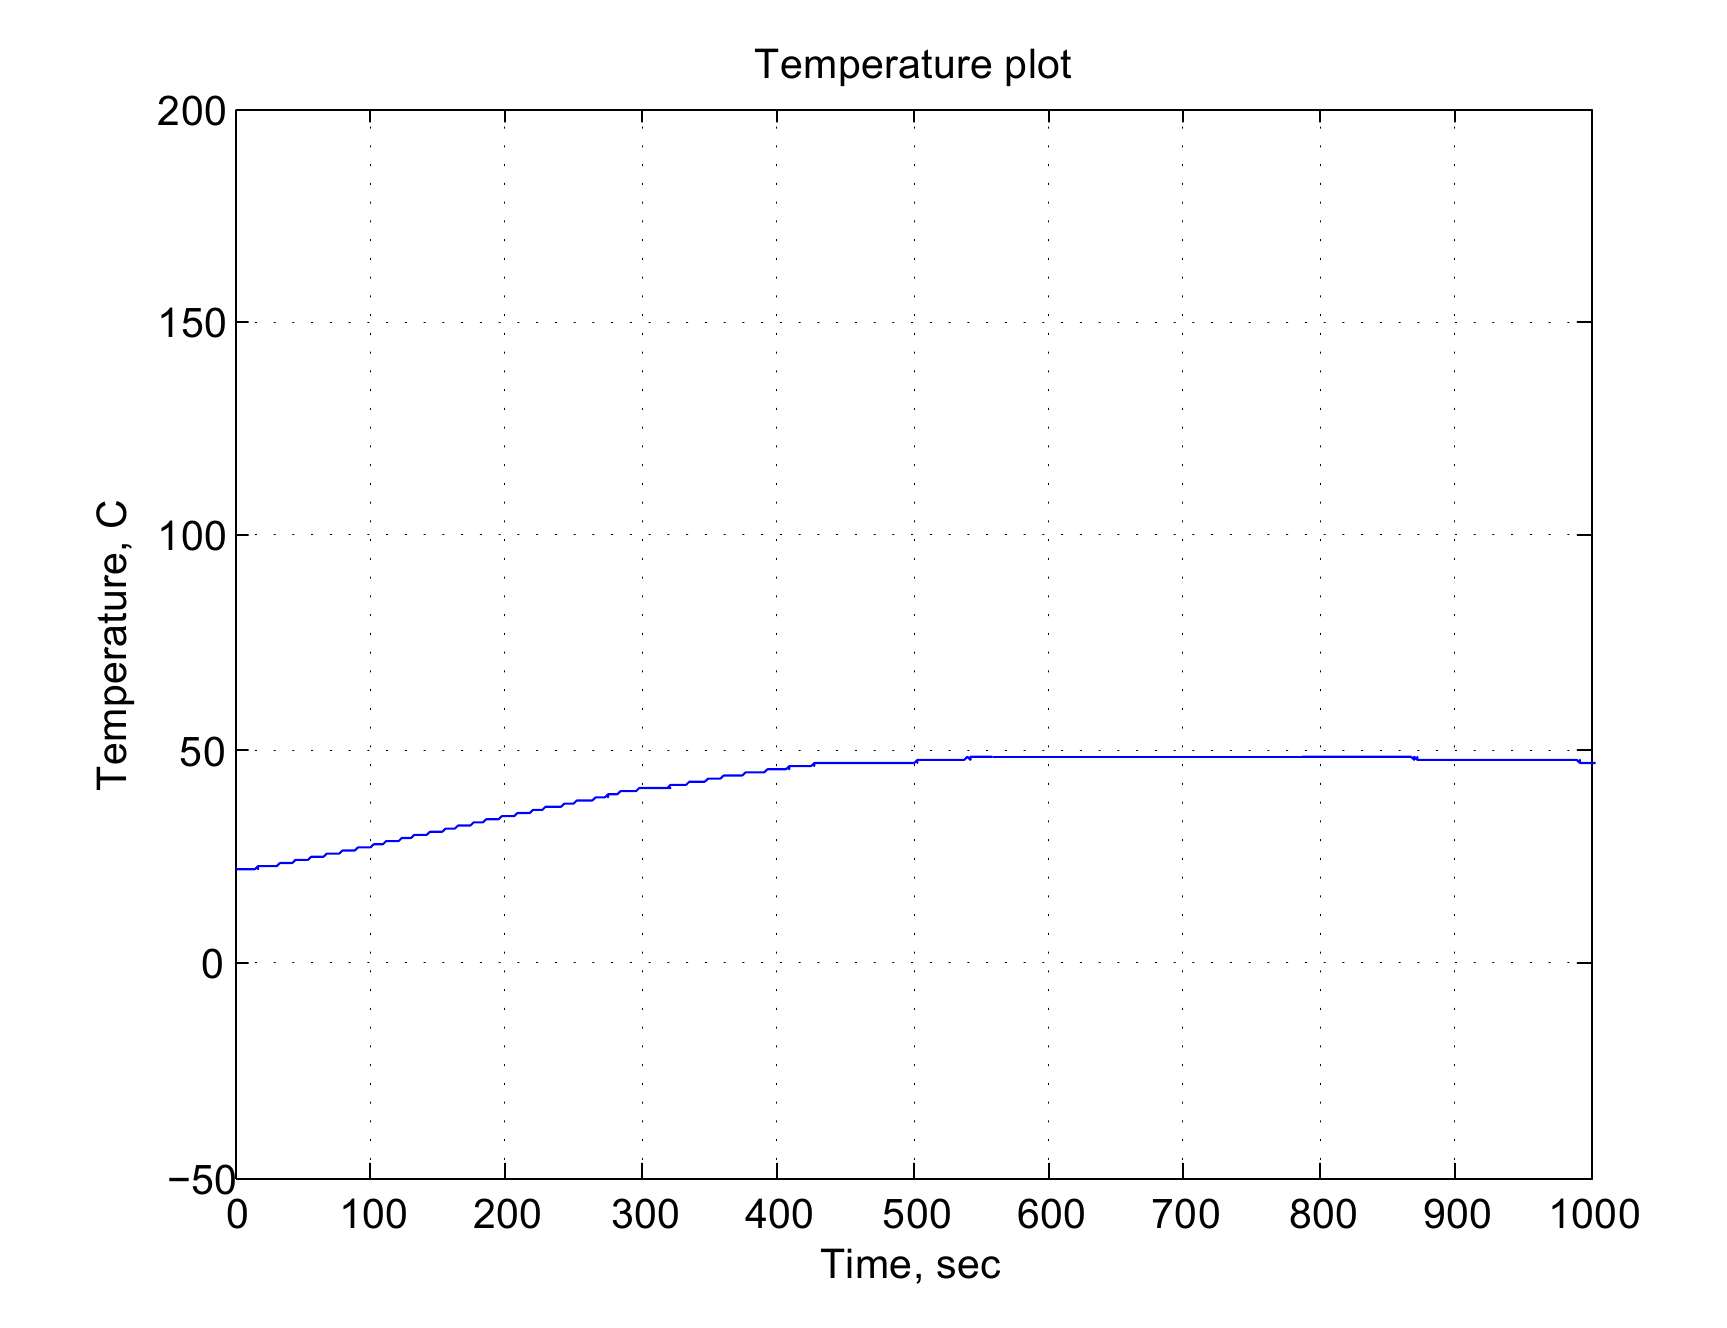
After the experiment, the flight data saved on the on-board SPI Flash Memory was read out to PC and processed in MATLAB by me. Below are plots. The time range of interest is between approximately 100s and 200s.
Acceleration data
Rate data
Pressure data
Temperature data
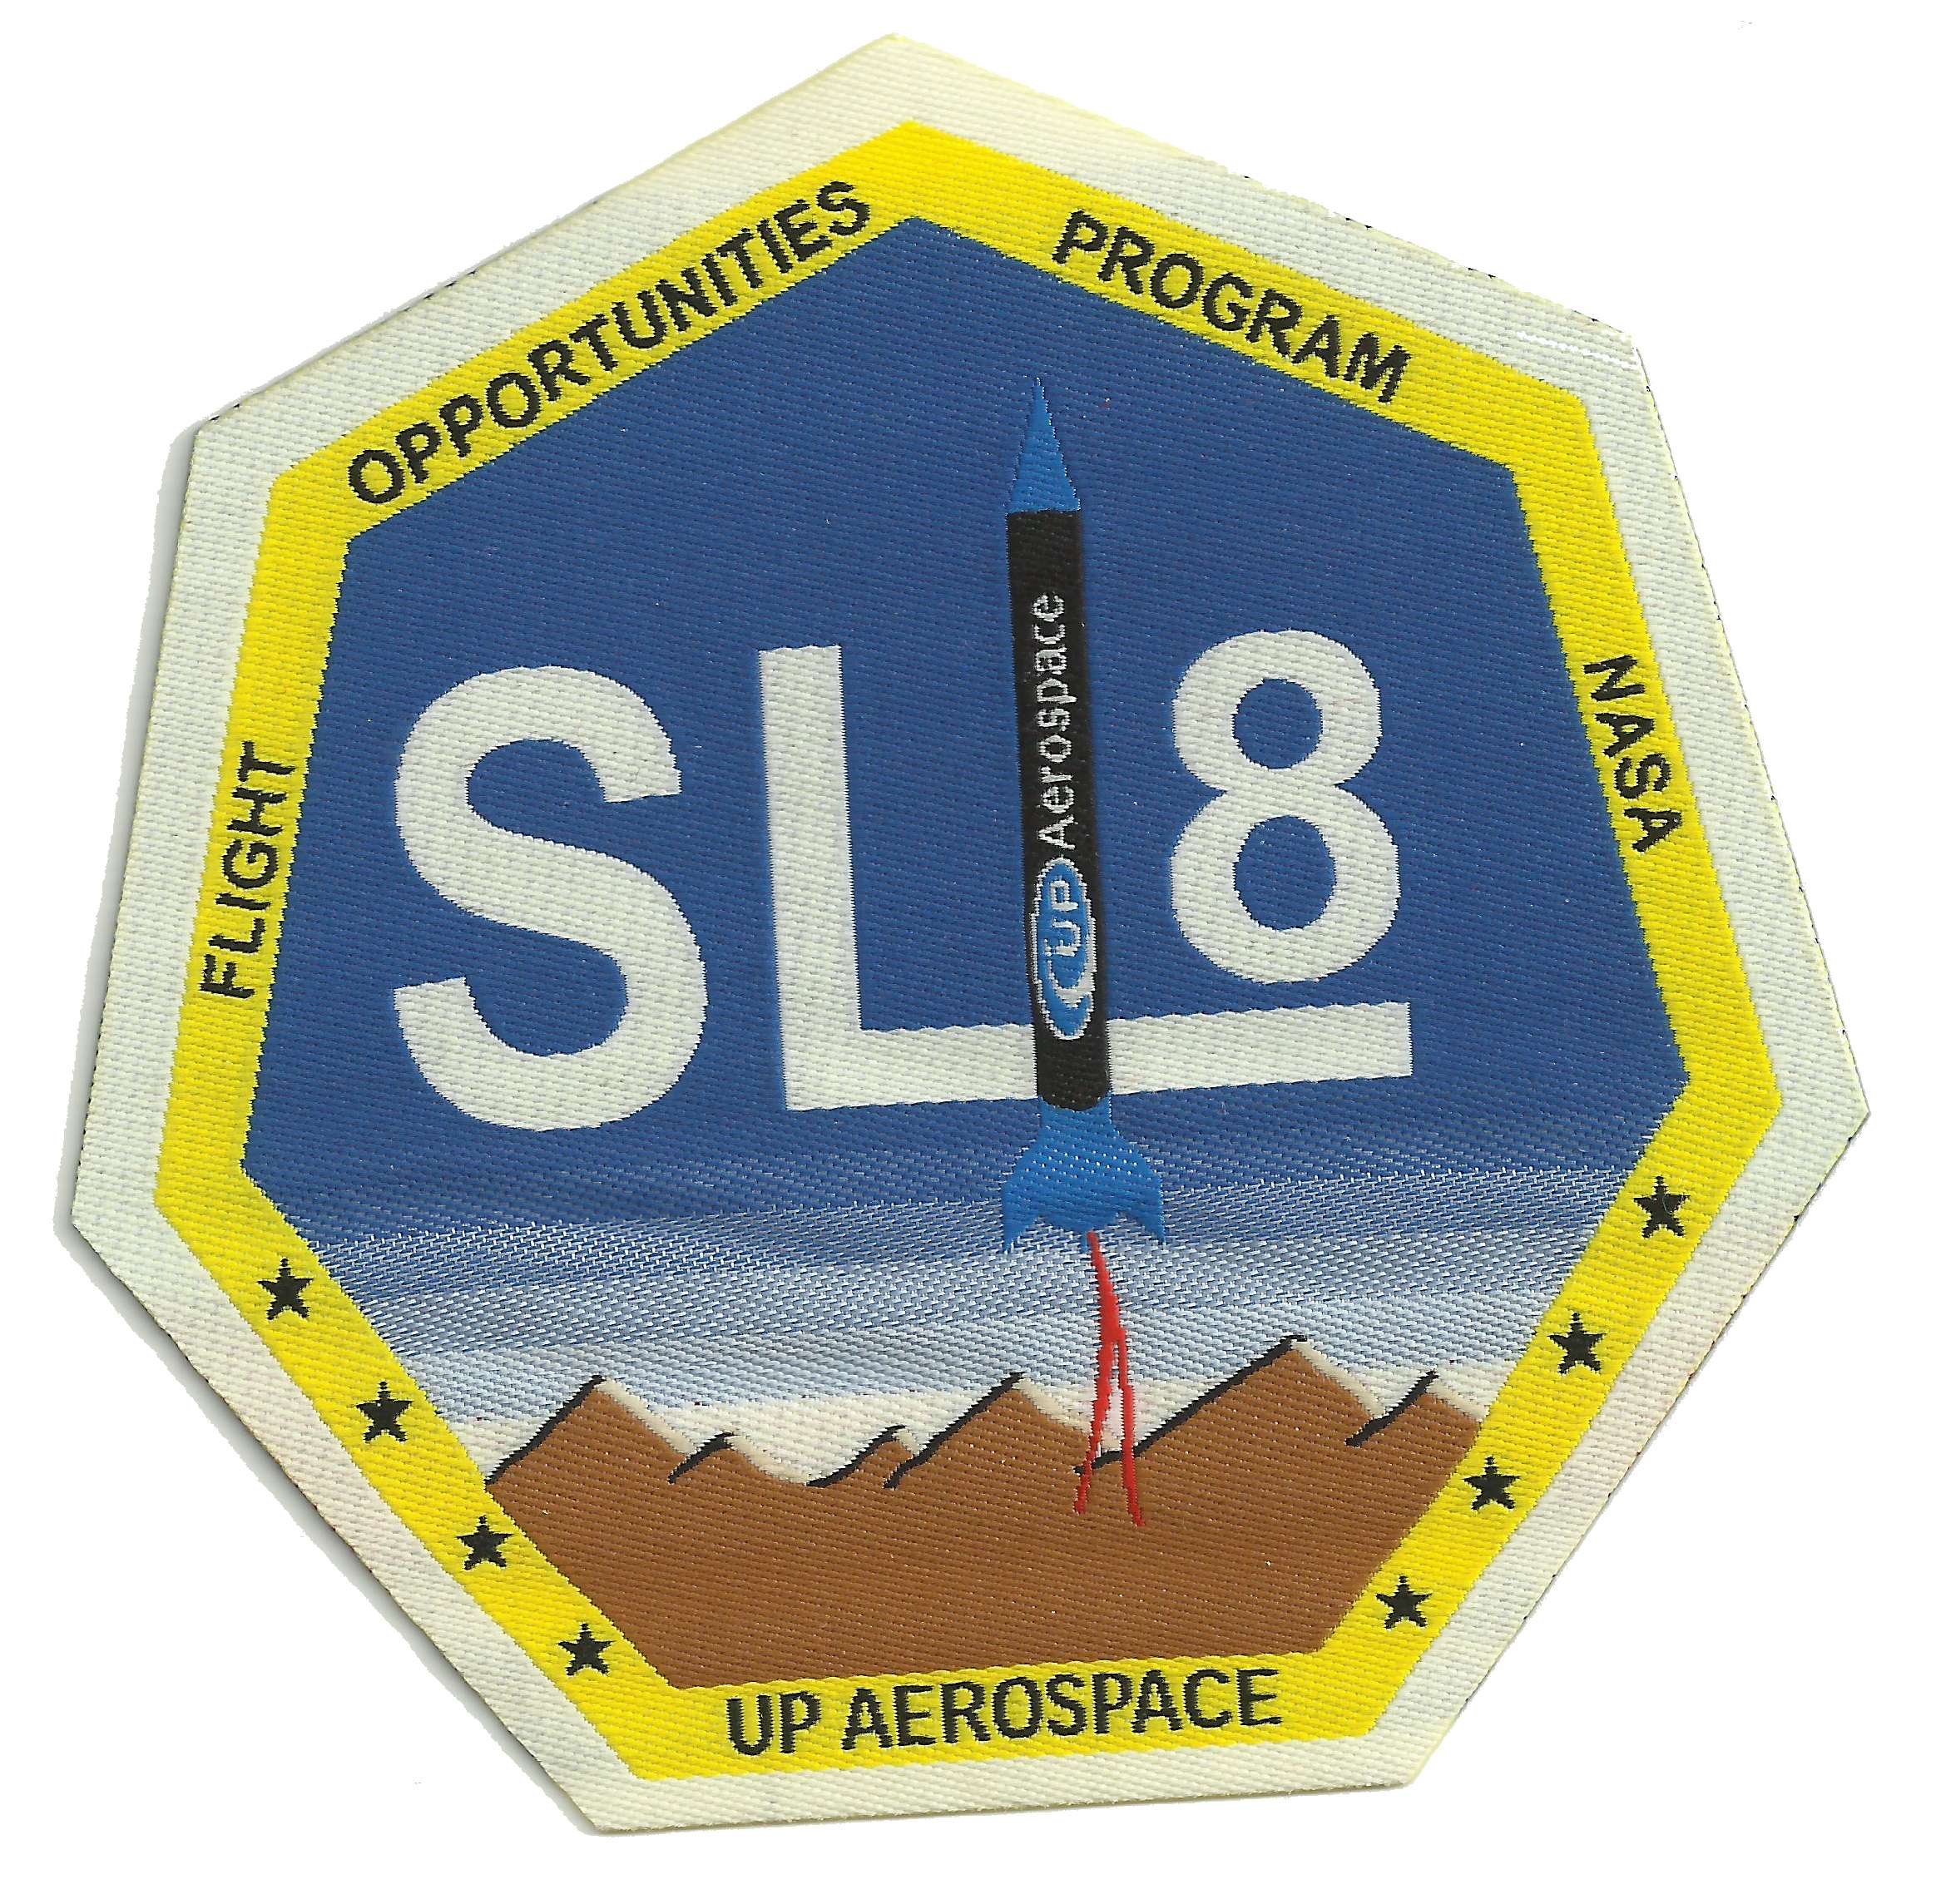
And of course, a flashy patch I received after the successful mission
